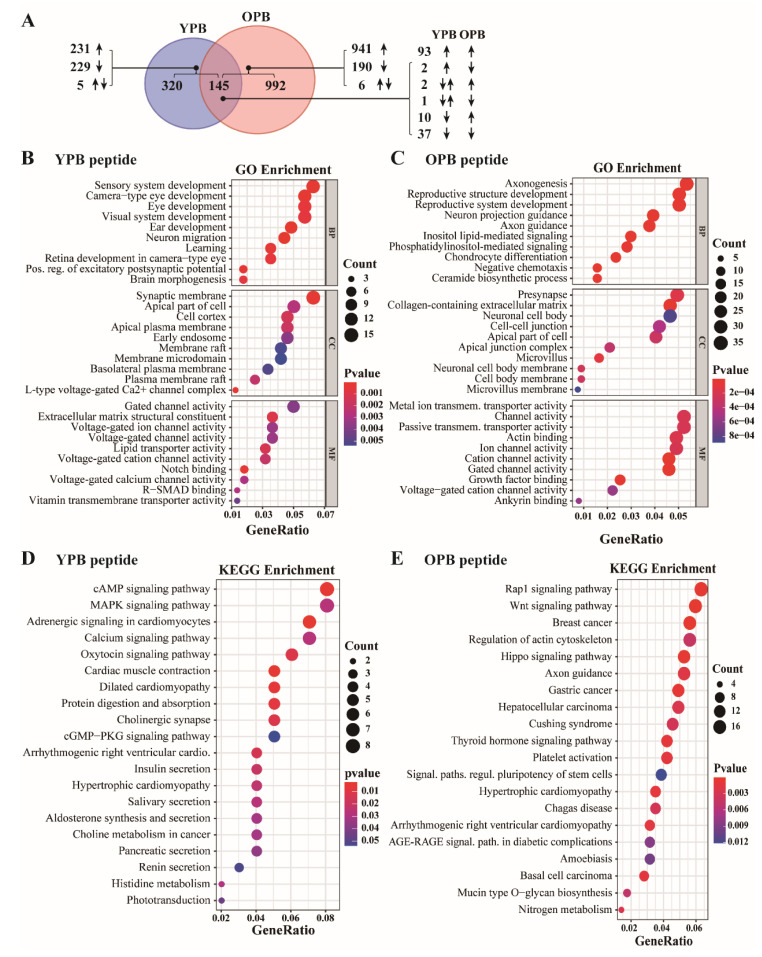
Figure 6.
Analyses of the H3K27me3 ChIP-seq data in peptide-treated MDA-MB-231 cells. (A) Numbers of genes with altered H3K27me3 ChIP-seq signal in the vicinity (−1000 to +1000 bps) of their TSSs when treated by YPB and OPB peptides, and their overlapped genes. The false discovery rate (FDR) was set as <0.05 and the threshold for the fold of change (FC) of H3K27me3 signal was 1.5. The upward and downward arrows designate the genes with increased or decreased H3K27me3 signal, respectively. The genes with both upward and downward arrows indicate that the genes have both increased and decreased H3K27me3 signal in their vicinity. (B,C) The top 10 GO terms of the GO analyses of the ChIP-seq data in MDA-MB-231 cells treated by YPB (B) and OPB (C) peptides. The analyses included biological process (BP), cell component (CC), and molecular function (MF) categories. (D,E) KEGG pathway enrichment analyses of the ChIP-seq data in MDA-MB-231 cells treated by YPB (D) and OPB (E) peptides.

