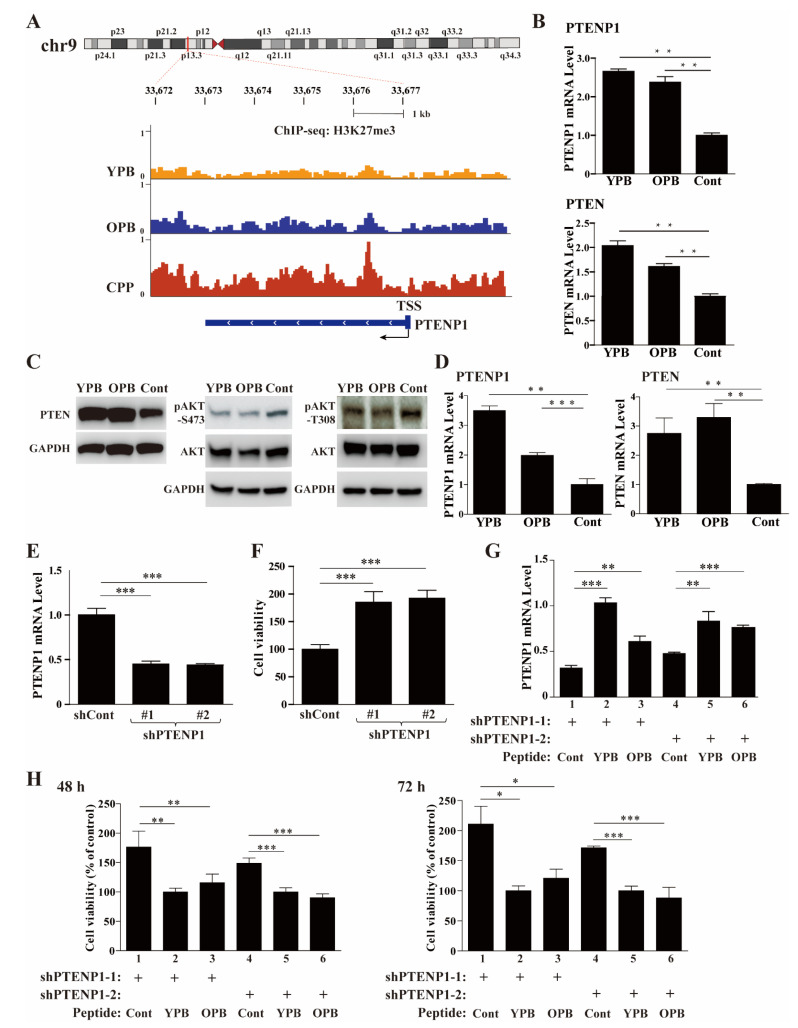
Figure 7.
PTENP1 is one of the primary targets of YPB and OPB peptides in breast cancer cells. (A) Gene browser tracks of the H3K27me3 ChIP-seq at the PTENP1 locus on chromosome 9 (chr9) in the genomic DNA of MDA-MB-231 cells treated by the peptides. The yellow, blue, and red peaks represent the degrees of H3K27me3 enrichment after the treatments for 48 h by 30 µM of the YPB, OPB, and Cont peptides, respectively. The region of the PTENP1 gene is labeled at the bottom panel. TSS: transcription start site. (B,C) Alterations of genes in the AKT pathway in response to the peptide treatments. After the treatment of MDA-MB-231 cells by the YPB, OPB, and Cont peptides, the cell lysates were analyzed by RT-qPCR to evaluate PTENP1 and PTEN transcript levels (B), and by Western blot analysis to determine the levels of PTEN, pAKT-S473, p-AKT-S308, and AKT, with GAPDH as a control (C). (D) Examination of PTENP1 and PTEN expression in xenograft tumors by qPCR. (E,F) Effects of shPTENP1-1 and -2 on the expression of the endogenous PTENP1 transcript (E) and viability (F) of MDA-MB-231 cells. (G,H) Effects of the cotreatments by shPTENP1-1/2 and each of the peptides on the PTENP1 transcript levels (G) and the viability (H) of MDA-MB-231 cells. The cells were infected by lentiviruses carrying either of the shPTENP1-1/2, and then treated for 48 h by 30 µM of the YPB, OPB, and Cont peptides. Relative PTENP1 transcript levels were determined by RT-qPCR, while the cell viability was calculated based on WST-1 assays. All data were normalized against the data of YPB. Each experiment was repeated at least 3 times with representative data presented. Data are shown as the mean ± S.D. * p < 0.05, ** p < 0.01, *** p < 0.001.

