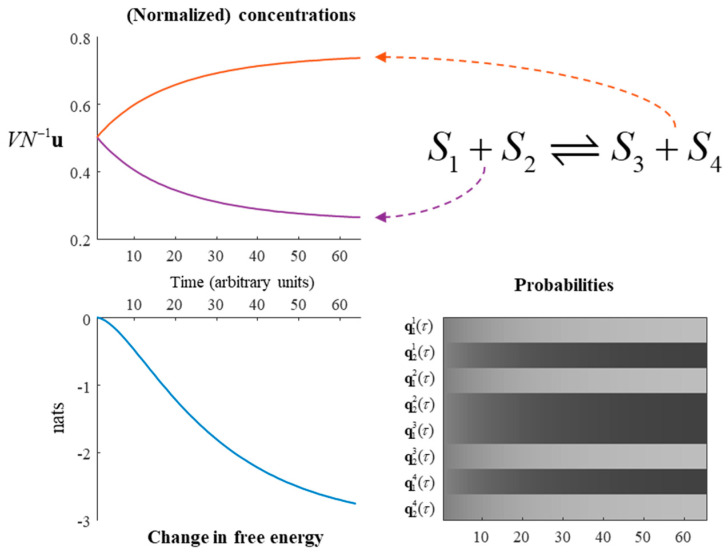
Figure 3.
A chemical reaction. This figure illustrates the solution to the generative model outlined in Equation (17), under the dynamics given in Equation (20). The upper-left plot shows the rate of change of the substrates and products. The two substrates have equal concentrations to one another, as do the two products. Under this model, with α = ¼, the substrates are converted into products until the substrates are at a quarter of their maximum concentration, with the remainder converted to the products. The same information is presented in probabilistic form in the lower right. Here, black indicates a probability of 1, white of 0, and intermediate shades represent intermediate probabilities. The plot of free energy over time shows that, despite the mean-field approximation and the constraints applied to the transition rate matrix, the reaction still evolves towards a free energy minimum—as in Figure 1. Note that, in the absence of an external input to this system, the free energy reduces to a Kullback–Leibler divergence between the current state and the steady state.

