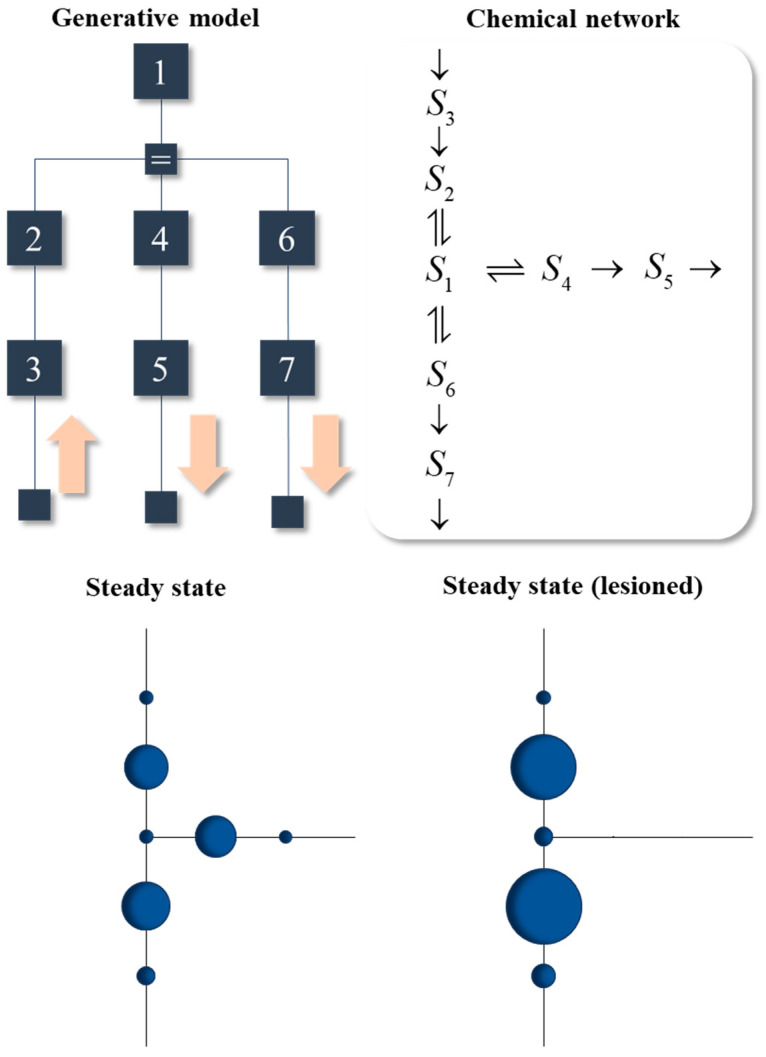
Figure 6.
Metabolic networks and their pathologies. This figure shows the conditional dependencies in a generative model in the upper left, highlighting the directional influences at the lowest level of the model with pink arrows. These ensure S3 is a sensory state, while S5 and S7 are active states. In the upper right is the chemical message passing that solves this model. The two plots in the lower part of the figure illustrate the relative probability of the marginal probabilities (or concentrations) of each chemical species. The spatial configuration matches that of the network in the upper right. The sizes of the circles indicate the relative concentrations once steady state has been attained. The plots on the left and right show the steady states before and after introduction of a lesion that disconnects the reaction from S1 to S4. Here, we see a redistribution of the probability mass, resulting in an alternative (possibly pathological) steady state.

