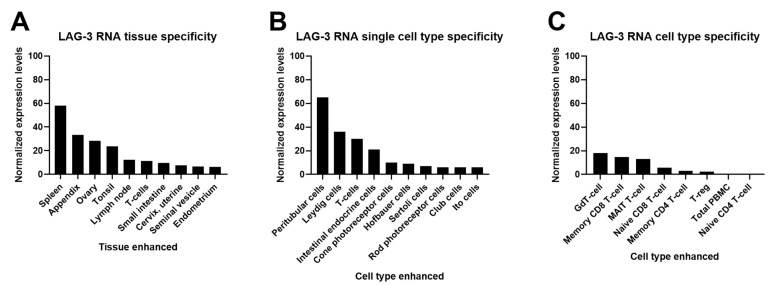
Figure 3.
LAG-3 protein and RNA expression profiles from Protein Atlas Analyses (http://www.proteinatlas.org; accessed on 2 May 2021). Images and data credit: Human Protein Atlas. Image and data available from: LAG3 protein expression profiles, The Human Protein Atlas. (A) LAG-3 consensus normalized expression (NX) levels for 55 tissue types and 6 blood cell types, created by combining the data from the three transcriptomics datasets (HPA, GTEx, and FANTOM5), using the internal normalization pipeline. Color coding is based on tissue groups by common functional features. RNA tissue specificity is enhanced in lymphoid and ovary tissues. (B) Summary of LAG-3 single-cell RNA (NX) from the indicated single cell types. Color coding is based on cell type groups, each consisting of cell types with functional features in common. (C) The bar graph represents quantification of RNA-seq data (pTPM) from blood cell types and total peripheral blood mononuclear cells (PBMC) that have been separated into subpopulations by flow sorting.

