
Figure 1. Action model for the CUSSH collaboration: change in cities.
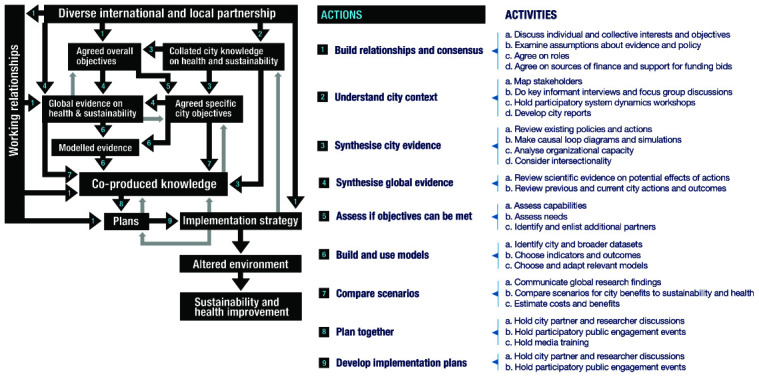
The boxes in Figure 1 represent outputs (‘nouns’: things that are produced and can be documented and measured) and the arrows represent the transition between them (‘verbs’: actions that influence movement from one box to the next). Each transition arrow on the diagram is mapped to a numbered action and activities which we expect will help achieve the transition, and which form a loose sequence described in the sections below. The overall pathway from a diverse partnership (top of diagram) to environmental and health improvement (bottom of diagram) includes a sequence of transitions over time. These transitions involve different actions and can occur simultaneously. The process is non-linear and, as befits complexity, there are feedback loops at all levels, the most obvious of which are outlined in the figure.