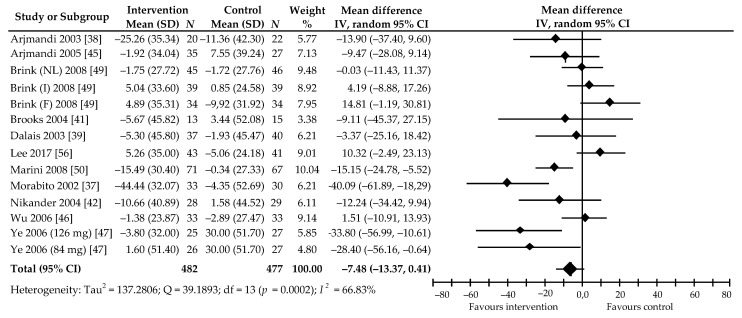
Figure 7.
Percentage change in urine DPD values associated with intake of soy isoflavones compared with placebo. Note: in parentheses after the author’s name, Isof dose in studies with more than one treatment arm, or abbreviations of the names of the countries where the study was conducted (NL, the Netherlands; I, Italy; F, France), are shown; data calculated from the random-effects model are presented as weighted mean difference; IV, inverse variance; df, degrees of freedom; the horizontal lines denote the 95% CIs.

