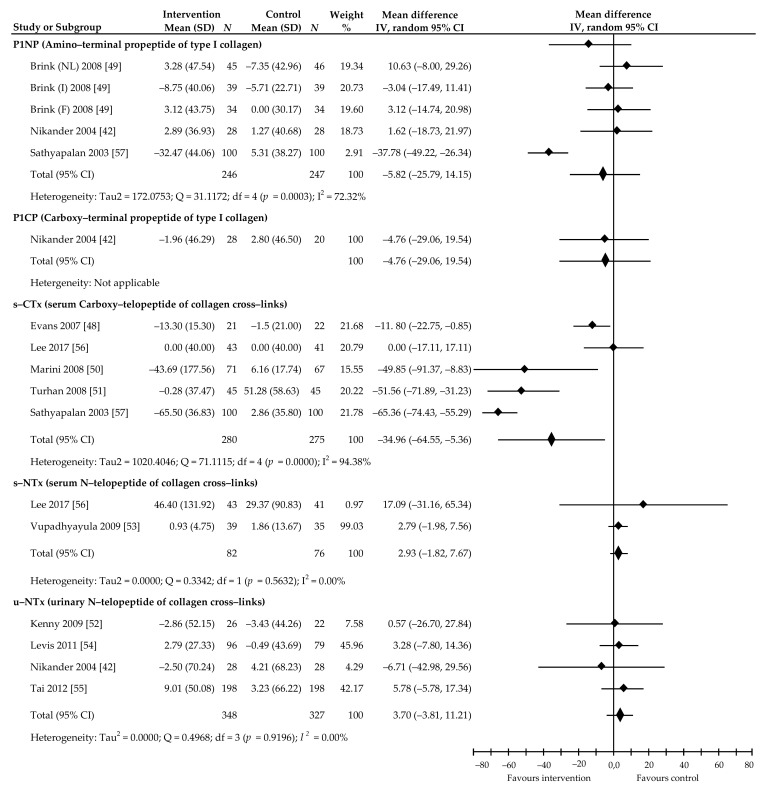
Figure 8.
Percentage changes in P1NP, P1CP, serum CTx, serum NTx, and urinary NTx values associated with intake of soy isoflavones compared with placebo. Note: abbreviations of the names of the countries where the study was conducted (NL, the Netherlands; I, Italy; F, France) are in brackets following the name of the lead investigator; data calculated from the random-effects model are presented as weighted mean difference; IV, inverse variance; df, degrees of freedom; the horizontal lines denote the 95% CIs.

