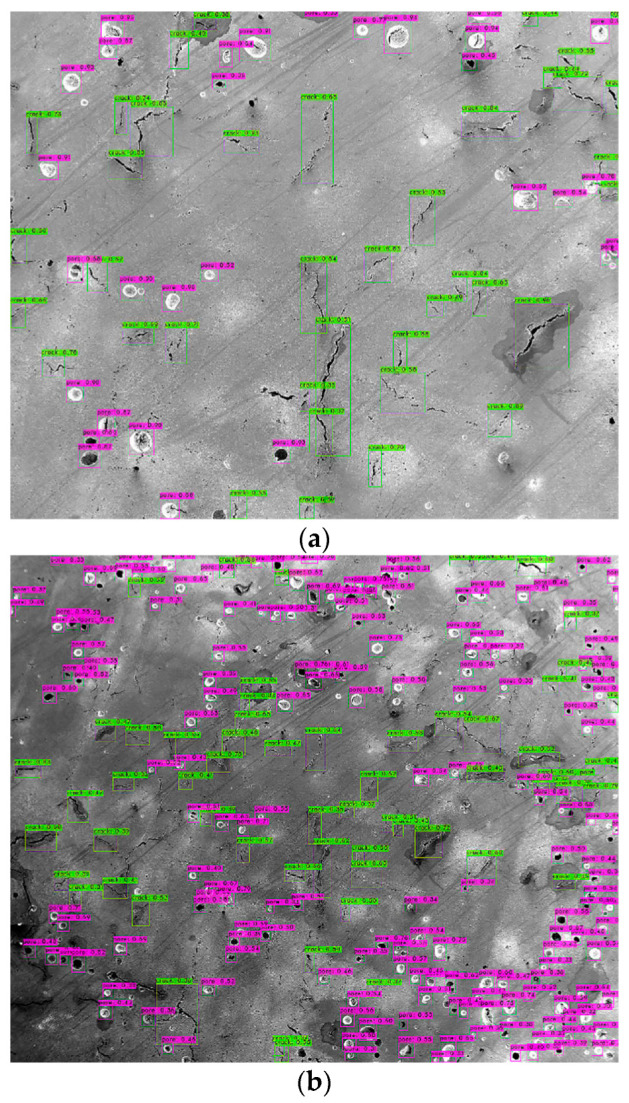
Figure 6.

The test result of the YOLOv4 model with the best weights and threshold of 0.3 (the red arrows indicate some of the missed defects) on two images with different defect densities. (a) test image with less defect density (b) test image with higher defect density.
