Figure 2.
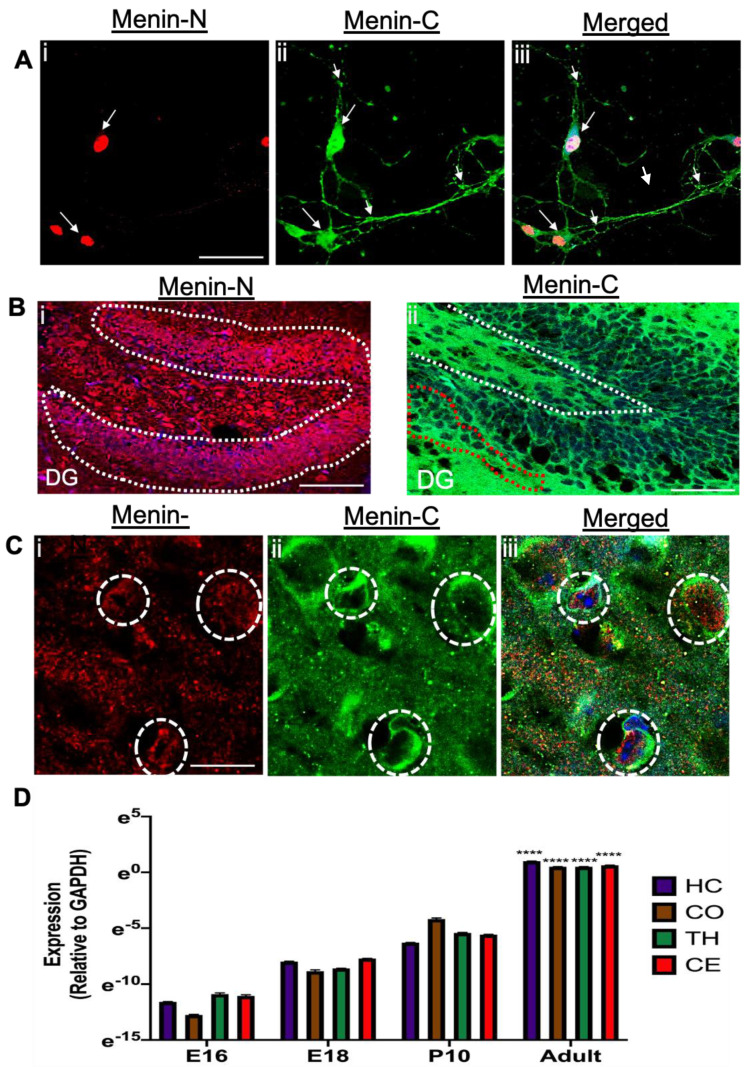
Hippocampus neurons labeled with α-C-terminal menin and α-N-terminal menin (in-vitro) and (in-situ) depicting that menin fragments are differentially localized in mouse neurons. (A) High magnification confocal image of cultured hippocampal neurons ROI at DIV 7(n = 18 images, 8 independent samples, representative image), adult mice hippocampal brain slices were labeled with α-N-terminal menin (Ai) α-C-terminal menin (Aii), (Aiii) shows merged channels. (B) As in (A), only depicting α-N-terminal menin (Bi) and α-C-terminal menin (Bii) localization in dentate gyrus (DG) hippocampal slice (n = 20 images, 12 independent samples, representative image). (C) High magnification confocal image of hippocampus slices depicting α-N-terminal menin (Ci) and α-C-menin termina (Cii), merged (Ciii) high expression in the neurons. Arrowheads, localization of N-menin in the nuclei with α-C-terminal menin in the perinuclear, cytoplasmic and synaptic regions as in (A) and (B) white dotted region represents N-menin expression in the nuclei, co-labeled with nuclear stain DAPI (Ai,Bi,Ci) red dotted regions depicts α-C-menin in the perinuclear and cytoplasmic regions respectively. (C) dotted circles represent individual neuron expressing both α-N-menin and α-C-menin. Scale bar, (A) 20 μm, (B) 25 μm (C) 5 μm. (D) Summary data, showing spatiotemporal fold changes in MEN1 gene expression in mouse brain from E12.5 to an adult brain; specifically, in hippocampus, thalamus, cortex and cerebellum, relative to control GAPDH gene, determined by qPCR (n = 6, 3 independent experiments each, triplicate replicates). Asterisks, statistical significance between the adult MEN1 gene expression and other ages (one-way ANOVA followed by post-hoc Tukey test); **** p < 0.0001. See also Supplementary Table S2.

