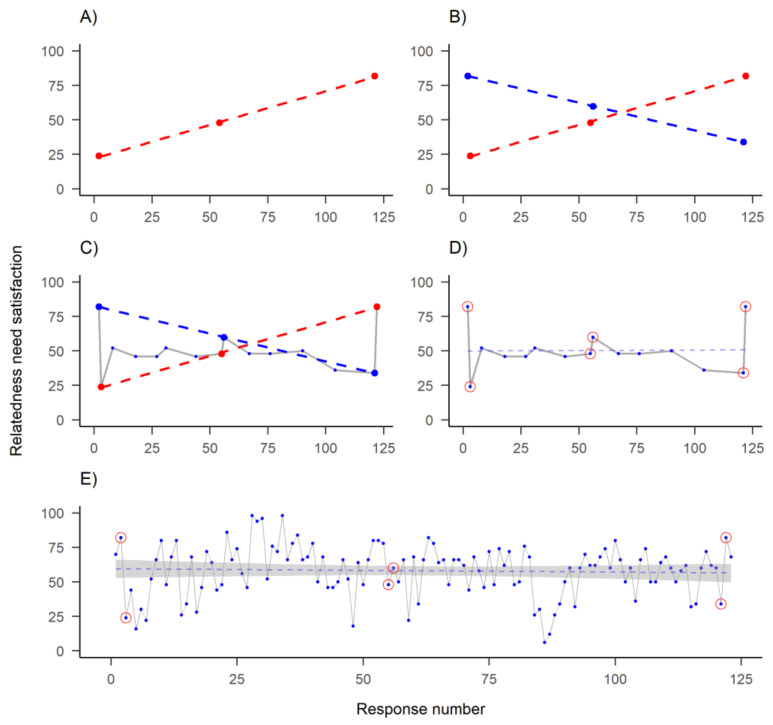
Figure 3.
One of the time series recorded by the participant featured in previous figure. Dots indicate answers to a visual analog scale question on their relatedness need satisfaction, as posited by self-determination theory (y-axis), measured on different time points (x-axis): (A) Measuring three time points—representing conventional evaluation of baseline, post-intervention and a longer-term follow-up—shows a decreasing trend; (B) Same measurement on slightly different days shows an opposite trend; (C) Measuring 15 time points instead of 3 would have accommodated both observed “trends”; (D) New linear regression line (dashed) indicates stationarity and (E) Including all 122 time points, a more complete picture of the dynamics emerges.

