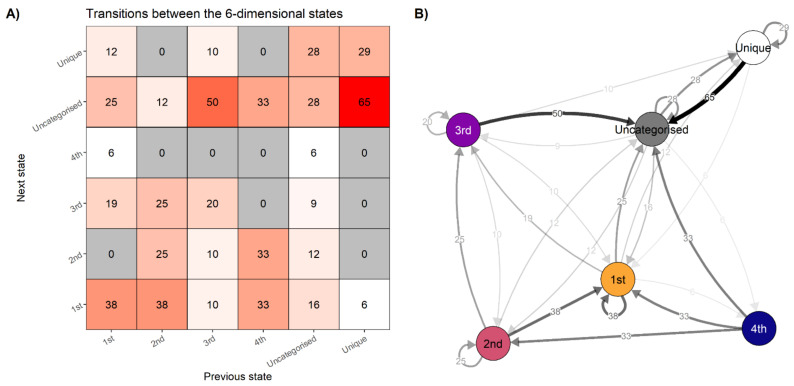
Figure 6.
Transitions between states. Panel (A). Percentages with which each state precedes the others. If the system is in the configuration labelled 1st, based on the relative frequencies of observed transitions, there is a 38% chance it stays in the same configuration, and a 25% chance it transitions to one of the uncategorised states—that is, states that are less strong than the state labelled 4th, but which appear more than once. Note that the zeroes do not signify this transition is impossible, only that it did not appear once during the data collection period. Columns may not sum to 100 due to rounding. Panel (B). Data from panel (A) represented as a transition network.

