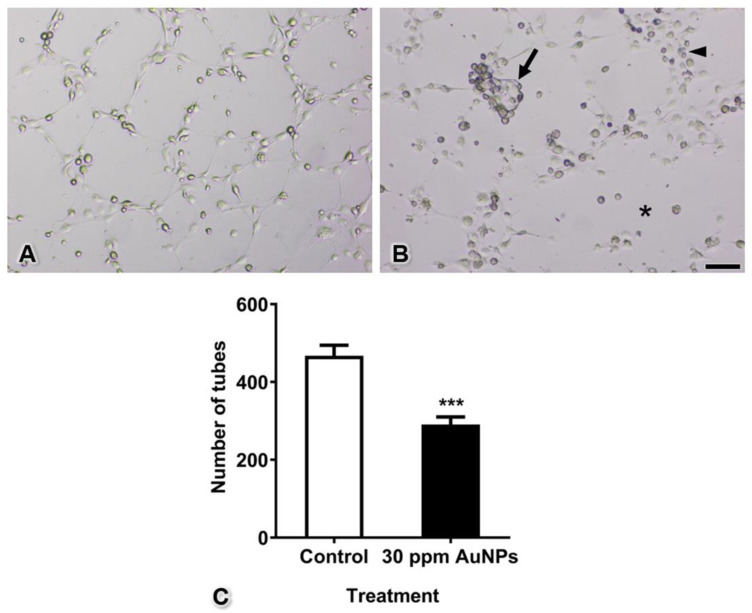
Figure 7.
Tube formation of the control group (in which intact endothelial cells were cocultured with intact pericytes) (A) and the AuNP-treated group (in which intact endothelial cells and pericytes were pretreated with AuNPs) (B). The graph shows the numbers of tubes (C). Note the cluster of mixed pericytes and endothelial cells (arrow), the thick wall of tube formation (arrowhead), and the area of incomplete tubes (asterisk). *** p < 0.001. Bar: 500 µm.

