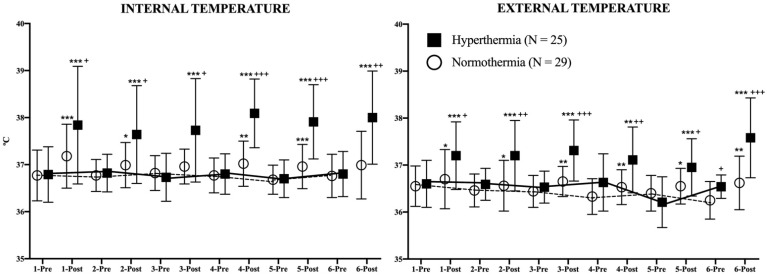
Figure 4.
Evolution of internal and external temperatures during the study. The continuous (hyperthermia) and the discontinuous (normothermia) lines represent the evolution of strength in basal (pre-exercise) conditions. Wilcoxon Test: Pre-post differences of each day in each group: * p < 0.05; ** p < 0.01; *** p < 0.001. Mann–Whitney U Test: Differences between groups at each time point: + p < 0.05; ++ p < 0.01; +++ p < 0.001.

