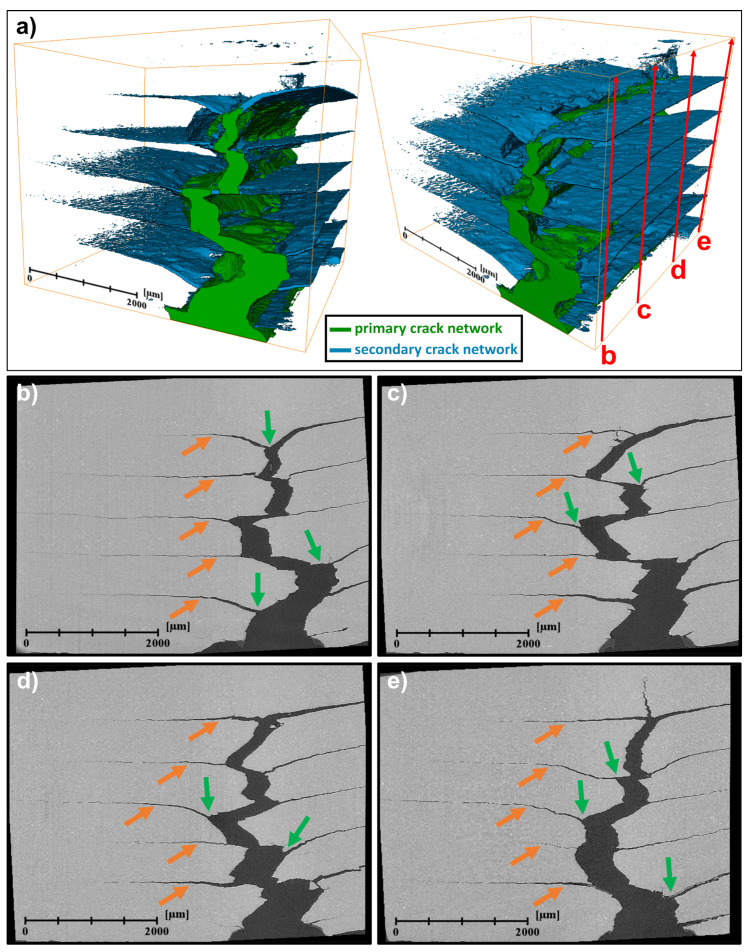
Figure 7.
Synchrotron X-ray computed microtomography (SXCT) on a AA1050/AA5754 N3(Nxr) laminated composite specimen fatigued at a constant stress intensity range of ∆K = 17.5 MPa√m. (a) 3D-reconstruction of the crack network of the LMC specimen indicating the separation into a primary and secondary crack network; (b–e) cross sections extracted from the 3D-tomogram at different positions z = 0.05 B, z = 0.33 B, z = 0.66 B and z = 0.95 B (indicated by red arrows in (a)) in relation to the specimen thickness B, respectively. Identification of the toughening mechanisms (a) crack deflection (orange arrows) and (b) crack bifurcation (green arrows) throughout the crack networks in all cross sections.

