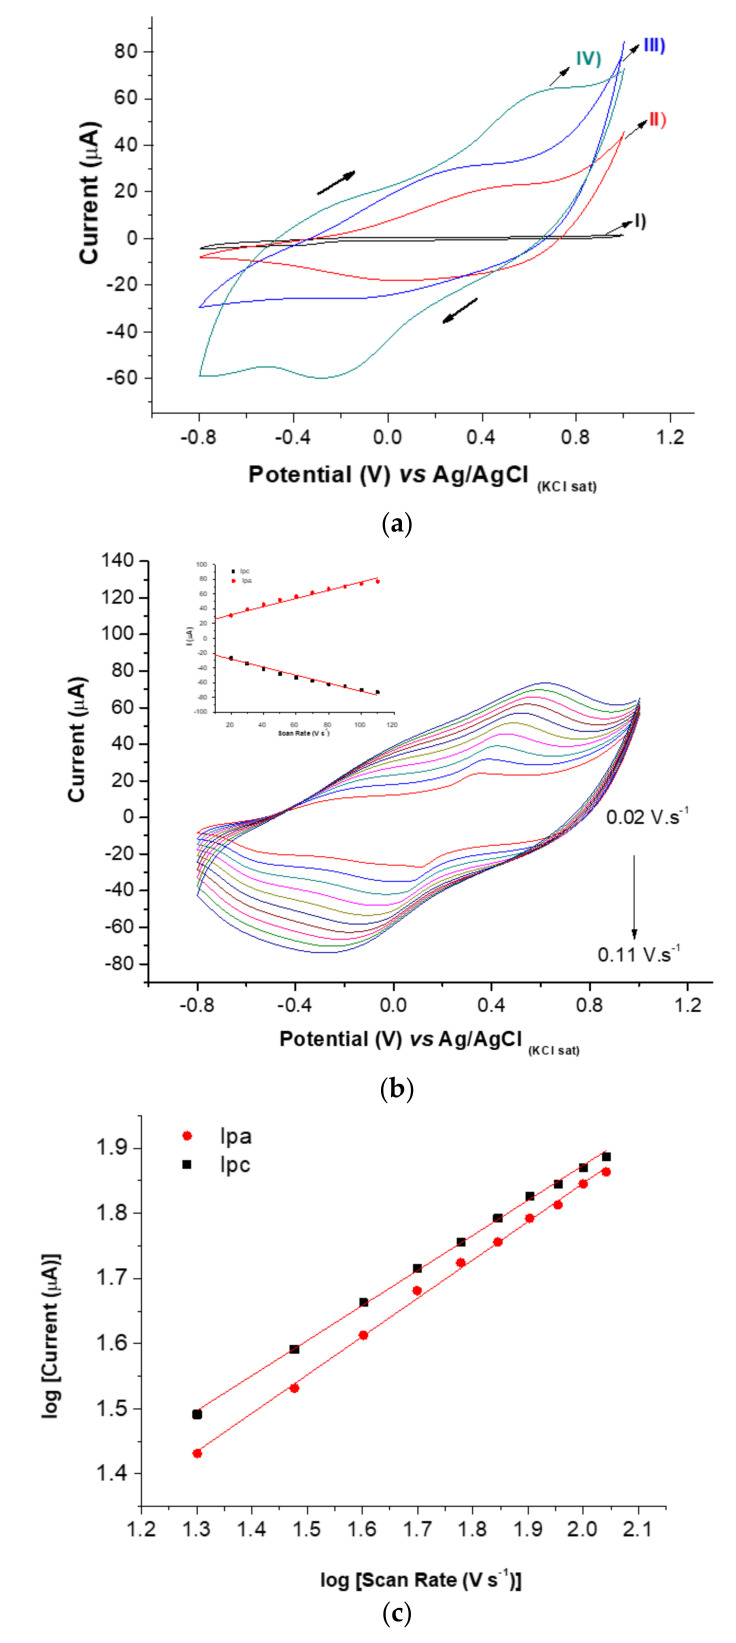
Figure 2.
(a) Cyclic voltammograms at 0.1 V s−1 scan rate: (I) bare SPE; (II) PPy/SPE; (III) PPy-CNT and (IV) PB@CNT-PPy. (b) Effect of the scan rate on the current response of the PB@CNT-PPy/SPE (from 0.01 to 0.12 V s−1) (inset: relationship between Ipa and Ipc vs. scan rate). (c) Plot of log Ipa and Ipc vs. log of scan rate. All measurements were performed in KCl (0.1 mol L−1) as support electrolyte.

