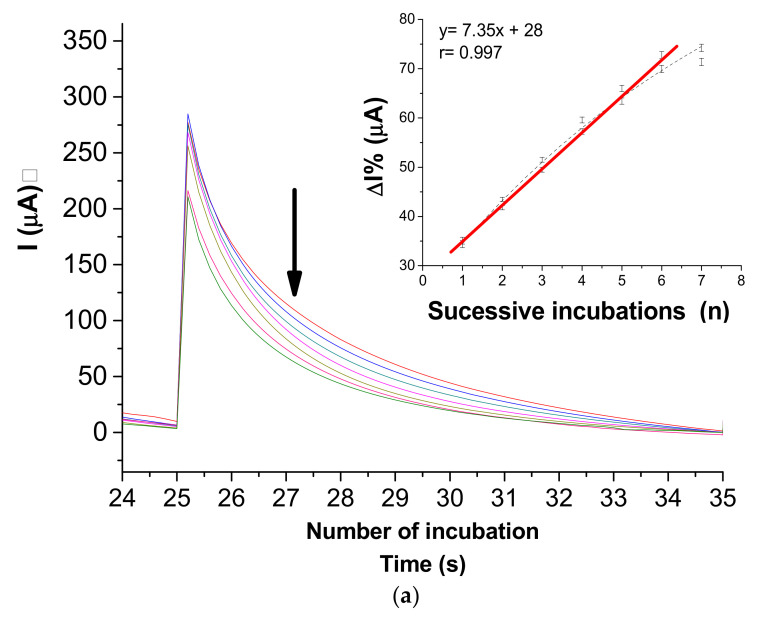
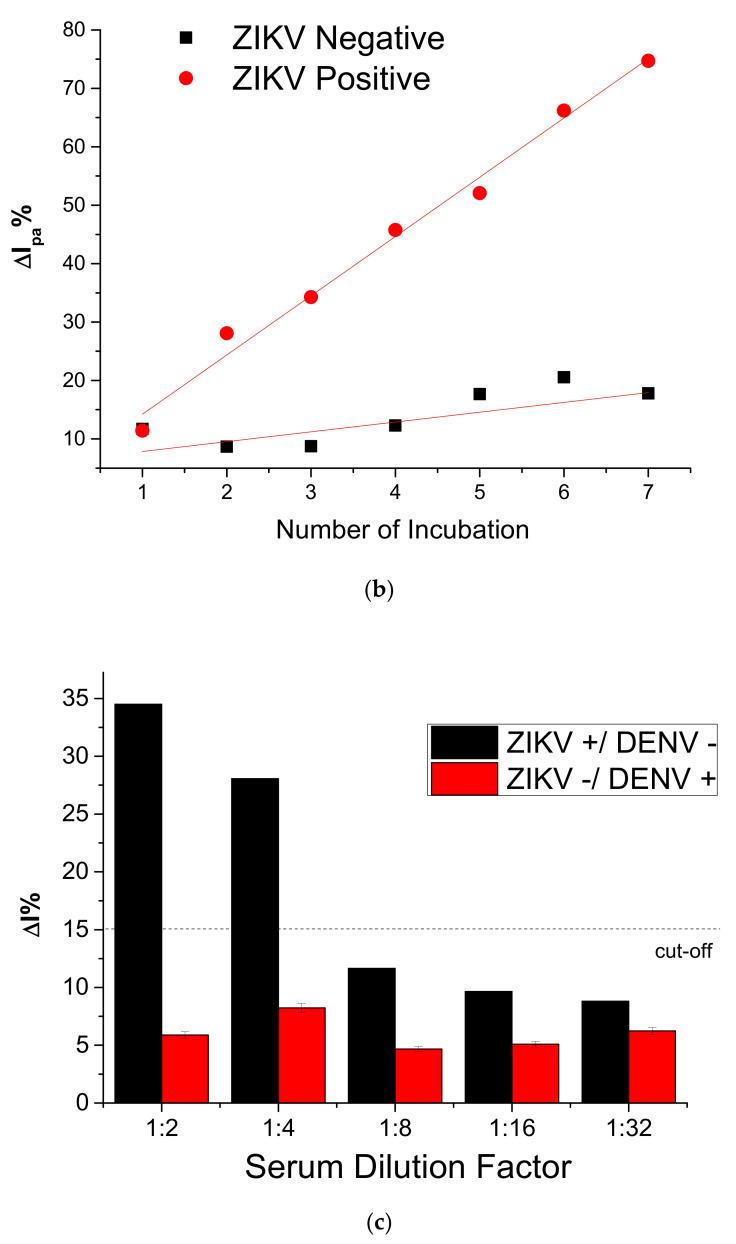
Figure 6.
(a) Chronoamperograms obtained after successive incubations with supernatants of the infected ZIKV cell-culture and PBS washes before measurements obtained in presence 0.1 mol L−1 KCl solution at 0.4 V fixed potential. Inset: linear fit adjusted for successive cell-culture incubations. (b) Analytical curve of the immunosensor in response to successive incubations with serum samples 1:100 PBS dilution of the ZIKV (positive)/DENV (negative) and ZIKV (negative)/DENV (positive), measured by chronoamperograms at 0.4 V vs. Ag/AgCl. (c) Bar diagram of current (with error bar of three replicates) as function of incubation number of ZIKV (positive)/DENV (negative) and ZIKV (negative)/DENV (positive).


