
FIG. 1.
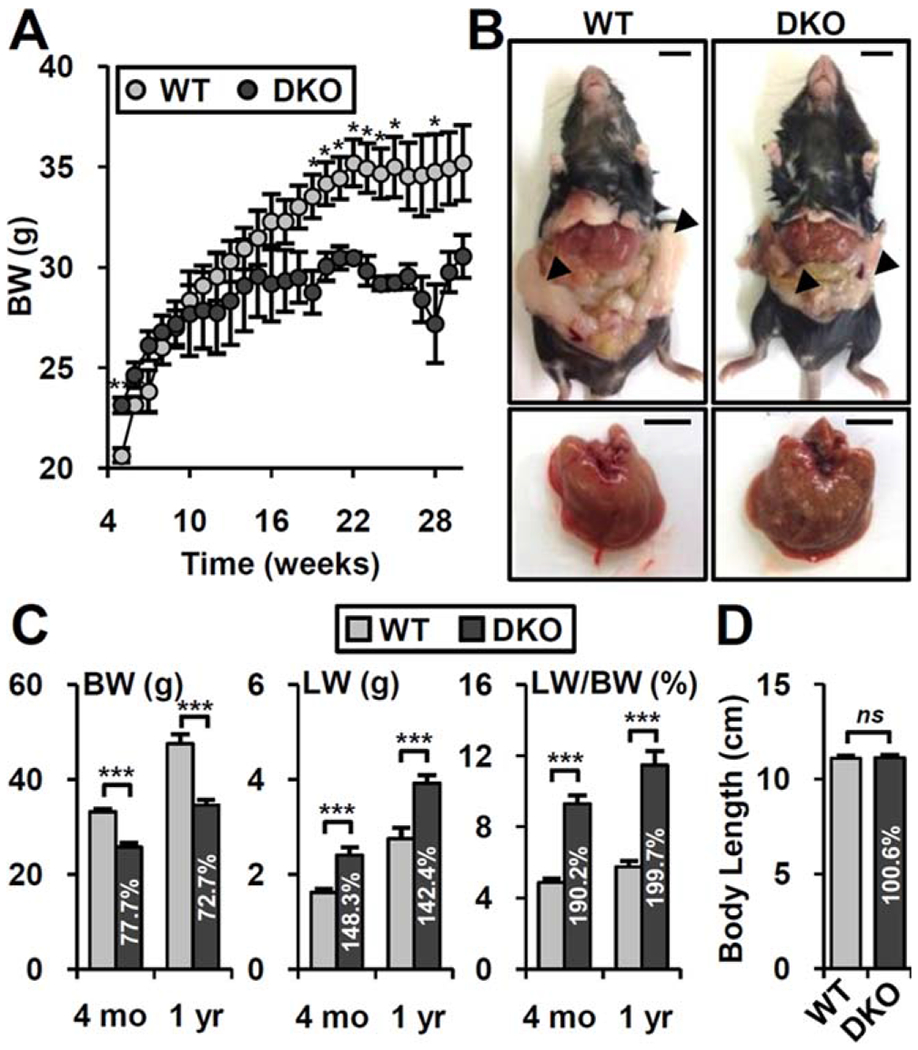
DKO mice prevent age-induced obesity. (A) Body weight changes of WT (n = 8) and DKO (n = 10) mice fed normal chow. (B) Representative picture of whole body and liver at 1 year of age. Arrowhead, epididymal adipose tissues. Scale bar, 10 mm. (C) Body weight, liver weight, and liver/body weight ratio at 4 months and 1 year of age. Values in the DKO bar graph indicated relative percentage compared to WT (percentage). (D) Body length (anal to nasal length) at 1 year of age (n = 5-8). Student t test: *P< 0.05, **P< 0.01, ***P< 0.005. Abbreviations: BW, body weight; LW, liver weight; ns, not significant.