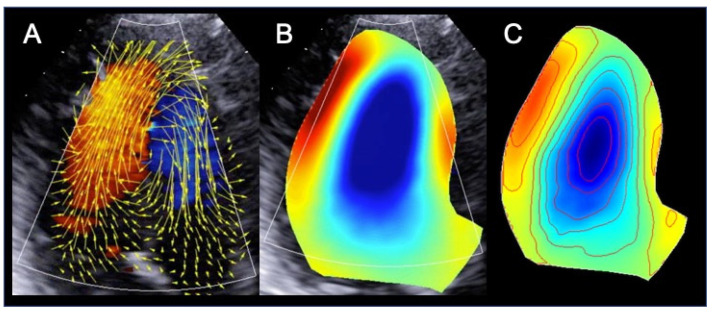
Figure 2.
Intracardiac flow dynamics in a patient with dilated cardiomyopathy. Different maps were used to represent flow properties. The vector flow map (A) shows that the flow circulates along the posterolateral wall and is rotating anteriorly at the level of the left ventricular apex. In the circulation map (B) this translates into the formation of a single large vortex, that rotates clockwise (blue color) at the mid-apical portion of the left ventricle. The steady-streaming flow map of one heartbeat (C) shows the streamlines and the color map of the vorticity field. All images were obtained using the HyperDoppler software of an Esaote Mylab X8 echo-scanner without contrast injection.

