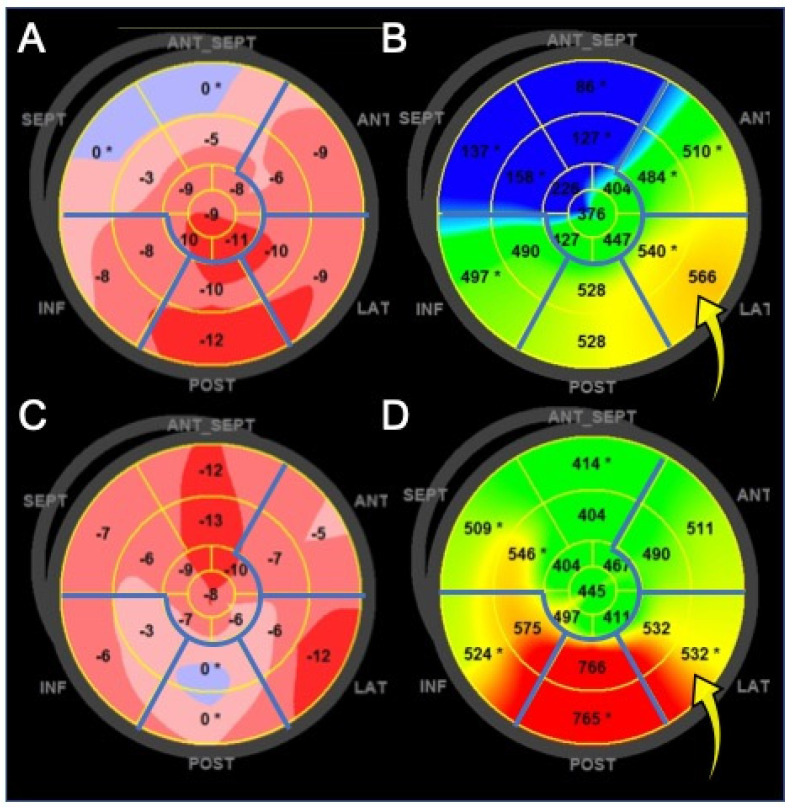
Figure 4.
Left ventricle (LV) color-coded polar maps of longitudinal myocardial strain. Panels on the left: map of strain amplitude. Clear pink and blue colors identify the most dysfunctional areas. Panels on the right: map of time-to-peak strain (dyssynchrony map). The red color represents the latest contracting myocardial areas. Basal and mid myocardial segments of inferior, posterior, lateral, and anterior walls (demarcated by the blue lines) are potential sites for LV pacing. (A,B) Patient with viable myocardium at the basal lateral wall, which is the site with latest contraction delay (optimal pacing site, yellow arrow). (C,D) The posterior wall is the most dyssynchronous, as indicated by the red color on the dyssynchrony map, but it is not the optimal pacing site because of the very low contraction amplitude. The best site for LV pacing is the lateral wall, although it is not the most delayed (yellow arrow).

