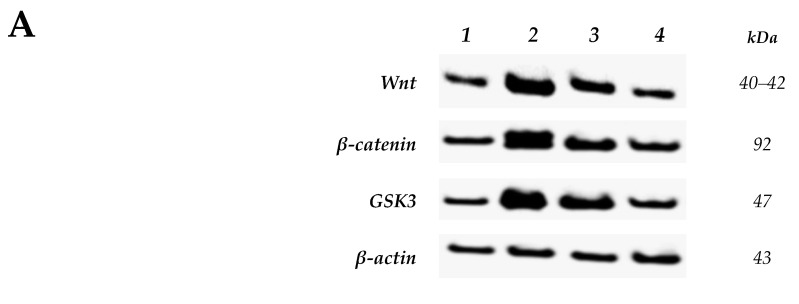
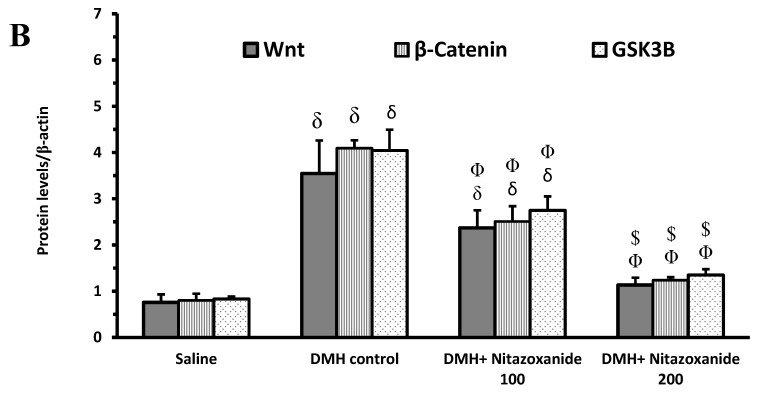
Figure 6.
Western blot analysis for Wnt/β-catenin/glycogen synthase kinase-3β (GSK3) proteins. (A): Western blot gels of the target genes in (1) saline group, (2) 1,2-dimethylhydrazine (DMH) control group, (3&4) DMH + nitazoxanide 100 and 200 mg/kg groups, (B): Column charts for Wnt, β-catenin and GSK3B proteins relative to β-actin. Data are mean ± standard deviation (SD) and analyzed by one-way analysis of variance (ANOVA) and Bonferroni’s test. δ Compared to saline group, Φ Compared to DMH control group, $Compared to DMH + nitazoxanide 100 group, p < 0.05.


