Figure 8.
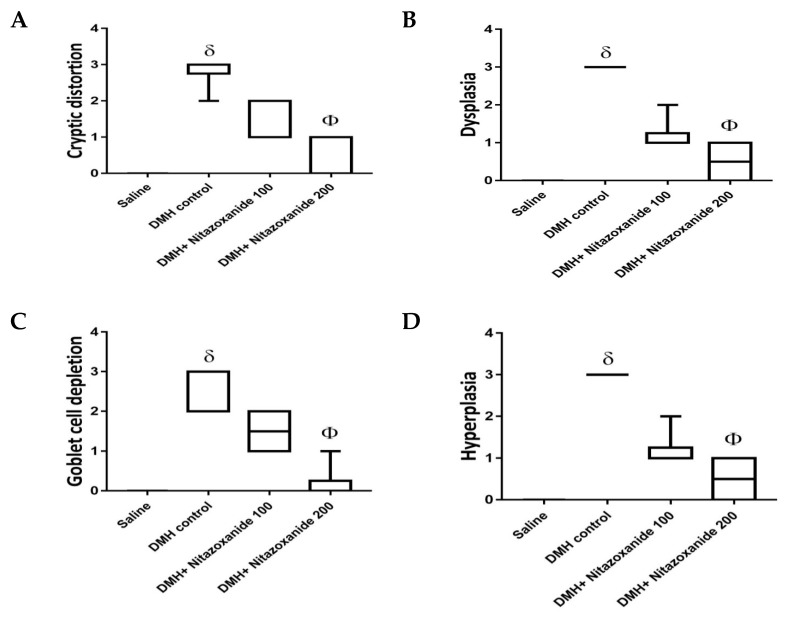
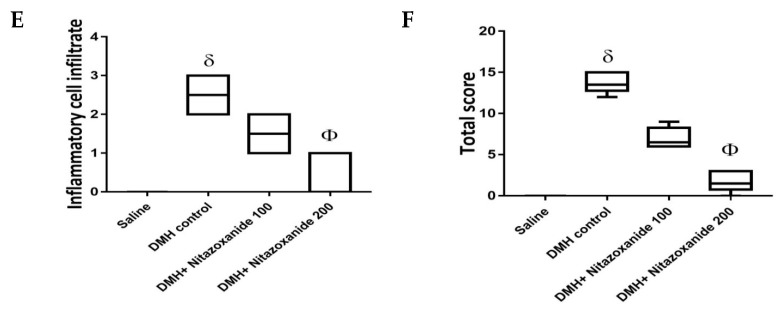
Histopathologic score for colon specimens stained with routine hematoxylin and eosin staining. Scores from 0–3 were assigned to each microscopic field for (A) Cryptic distortion, (B) Dysplasia, (C) Goblet cell depletion, (D) Hyperplasia, (E) Inflammatory cell infiltrates and (F) total histologic score. Data are box-and-whisker plots for the scoring values for 5 fields/colon section. δ Compared to saline group, Φ Compared to DMH control group, p < 0.05.


