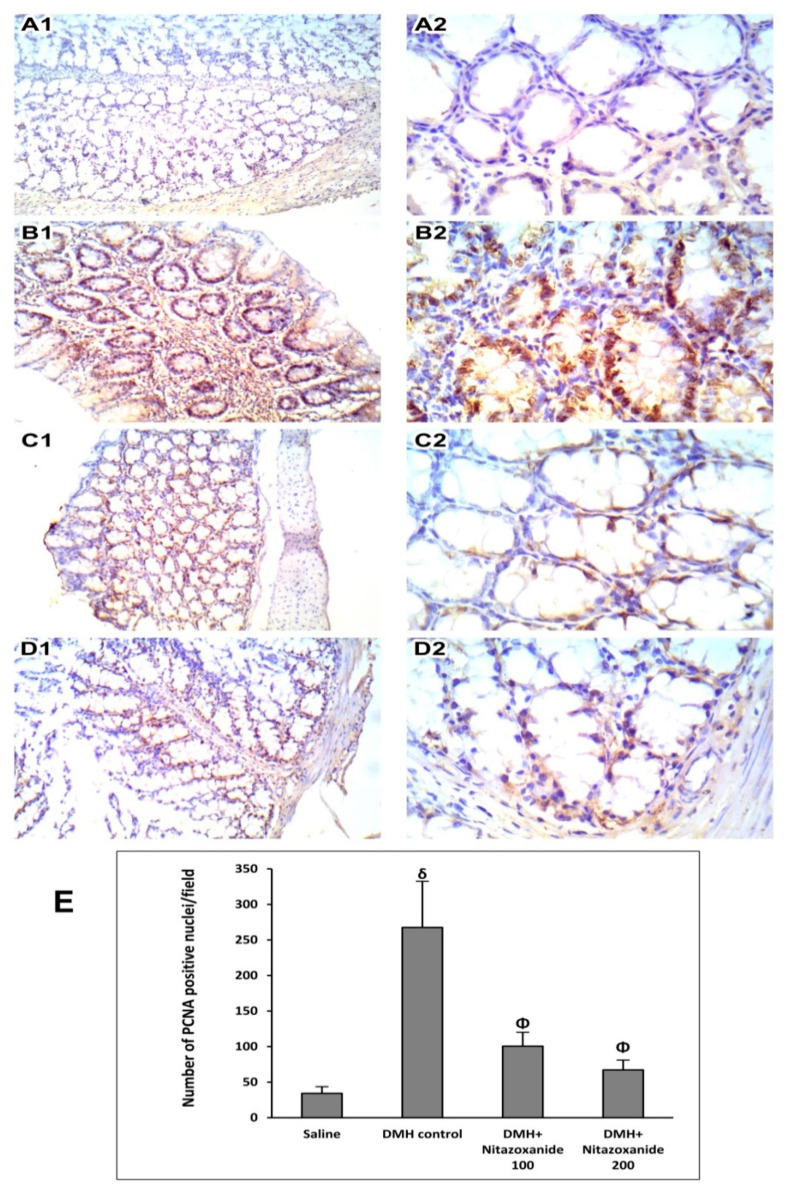
Figure 9.
Immunohistochemistry for proliferating cell nuclear antigen (PCNA) in colon samples. (A1) and (A2) images of saline group showed regular mucus and mild staining and basal flattened nuclei. (B1) and (B2) images of DMH control group showed high nuclear staining. (C1) and (C2) images of nitazoxanide 100 mg/kg treated group showing moderate PCNA staining. (D1) and (D2) images of nitazoxanide 200 treated group low staining for PCNA. PCNA immunohistochemistry, (A1, B1, C1 and D1: 100×, A2, B2, C2 and D2: 400×). (E) Column chart for the number of PCNA positive nuclei per field, 5 random fields per tissue section. δ Compared to saline group, Φ Compared to DMH control group, p < 0.05.

