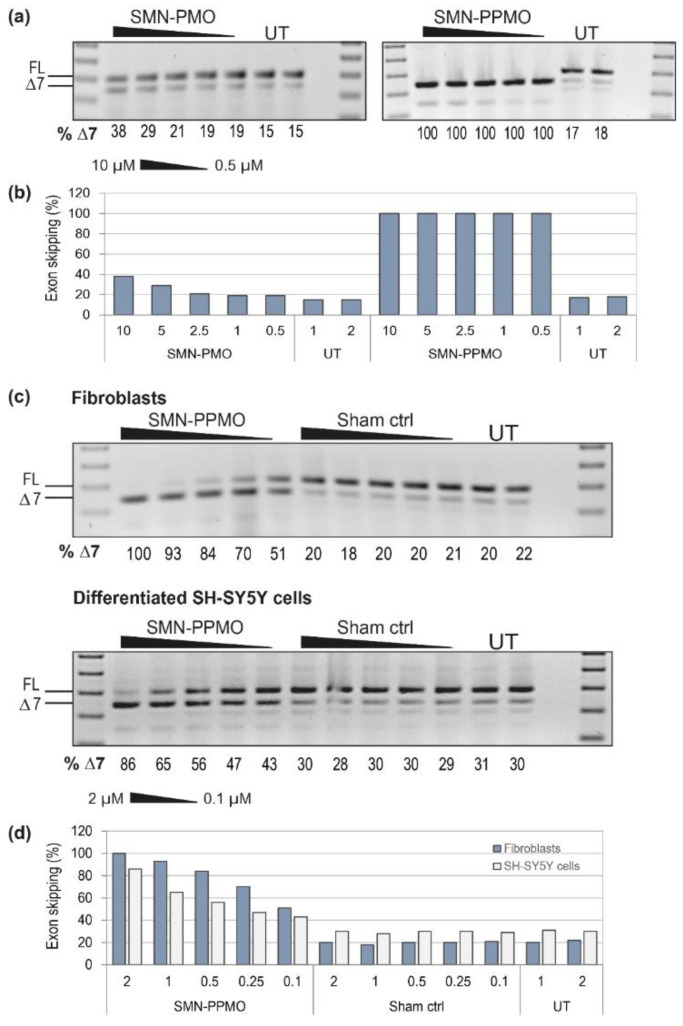
Figure 3.
Analysis of AO chemistry and delivery after transfection into fibroblasts and neuronal cells, showing (a) RT-PCR across SMN transcripts following transfection with exon skipping PMO and PPMO into fibroblasts at 10, 5, 2.5, 1 and 0.5 µM; (b) graphical representation of densitometry as in (a); (c) RT-PCR of SMN transcripts in fibroblasts and SH-SY5Y cells, following transfection with the SMN-PPMO at 2, 1, 0.5, 0.25 and 0.1 µM; and (d) graphical representation of densitometry as in (c). The full length transcript (FL, 404 bp) and exon 7 skipped product (delta-7(Δ7), 350 bp) are indicated by the lines to the left of the gel, and the percentage of Δ7-SMN transcript, as determined by densitometry is shown below each lane for comparison to controls and untreated (UT) cells. A 100 bp size marker was used for size comparison and a no template RT-PCR control (NTC) was loaded in the final lane.

