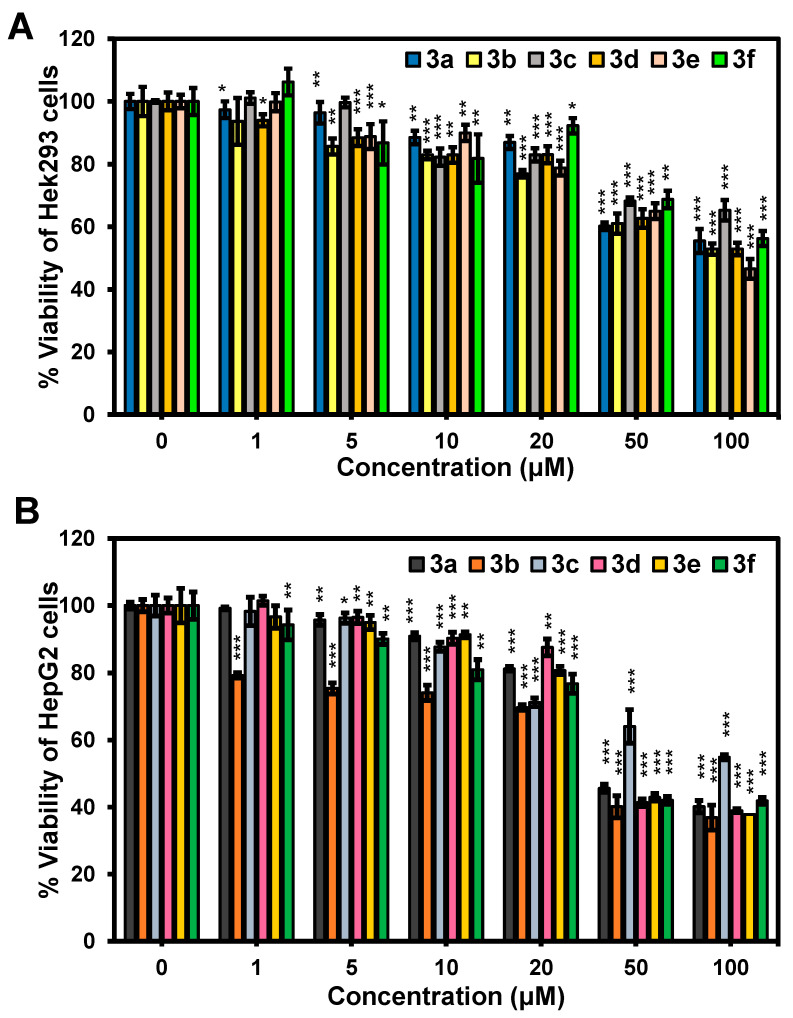
Figure 5.
Cytotoxicity effect of chalcones 3a–f on the cellular viability of HEK-293 (A) and HepG2 (B). All cells were treated with chalcones 3a–f at different concentrations for 24 h (error bar represents standard deviation, n = 3). Statistical analysis is based on one-way ANOVA (* p < 0.05, ** p < 0.01, *** p < 0.001).

