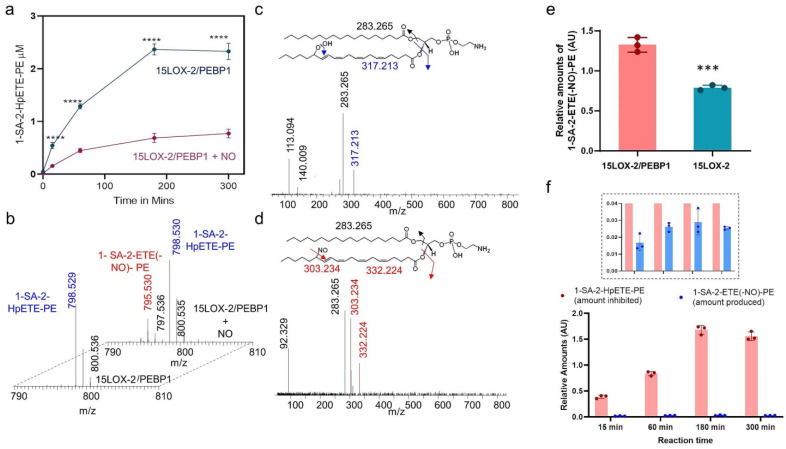
Figure 1.
Effect of NO● on peroxidation of 1-SA-2-ETE-PE by the 15LOX-2/PEBP1 complex. (a) Kinetics of the production of 1-SA-2-HpETE-PE by 15LOX-2/PEBP1 in the presence and absence of NO● donor. Data are mean ± SD, n = 3, *** definition; **** p < 0.0001 vs. 15LOX-2/PEBP1 + NO, two way ANOVA, Sidak post-hoc analysis. (b) Mass spectrum showing the nitrosylated product formed upon 1-SA-2-ETE-PE incubation with 15LOX-2/PEBP1+PAPA NONOate (back). Nitroso-1-SA-2-ETE-PE (1-SA-2-ETE(-NO●)-PE) was not detected in the system without PAPA NONOate (front). Fragmentation analysis of 1-SA-2-HpETE-PE (c) and 1-SA-2-ETE(-NO)-PE (d) showing representative fragments. The insets at the top show the structures of 1-SA-2-HpETE-PE, 1-SA-2-ETE(-NO)-PE and their possible fragments. (e) Bar plot comparing 1-SA-2-ETE(-NO)-PE formation by 15LOX-2 and by 15LOX-2/PEBP1, both in the presence of NO●. Data are mean + SEM., n = 3, *** p = 0.0007, student’s t-test. (f) Bar plot showing that the amount of 1-SA-2-HpETE-PE inhibited by NO● is significantly larger than the amount of 1-SA-2-ETE(-NO)-PE produced, as a function of reaction time. The inset bar plot shows the enlarged view of the lower plot, between the ordinate values 0.0 < y < 0.04 (AU).

