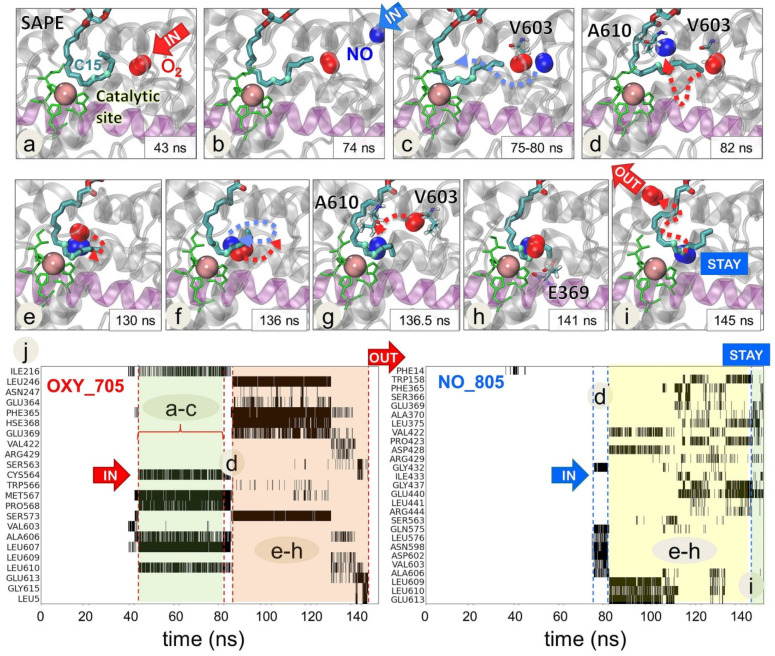
Figure 3.
Competition between NO● and O2 molecules near the C15 atom of the AA-chain of SAPE at the catalytic site of 15LOX-2 complexed with PEBP1. A sequence of MD snapshots (a–i) illustrates the time evolution of the positions of a NO● radical (NO_805) and an O2 molecule (OXY_705) during the period 43 < t < 150 ns of the simulations. A first O2 (a) reaches the catalytic site at t = 43 ns, followed by a NO● at t = 74 ns (b,c) which disrupts the binding of O2. After a competition process during which the two molecules undergo multiple fluctuations and dislocations in their positions, the O2 molecule ends up leaving the catalytic cavity at 145 ns (i). Catalytic site residues (H373, H378, H553, and I676) are displayed in green and sn-2 chain of SAPE as cyan-red-blue sticks. Two highlighted atoms of SAPE (light cyan spheres) denote C13 and C15 atoms as reference points. NO● and O2 are shown in blue and red spheres, respectively. The region between the helices α12 and α14 is colored in light violet. Lower panels (j) display the detailed time evolution of contacts between 15LOX-2 residues and O2 (left panel) and NO● (right panel) molecules. This panel includes only those residues that undergo frequent contacts (cumulative contact time of 2.5 ns) with O2 (left) or NO● (right) during the simulation period of 150 ns. Contacts are shown by black shades/bars for each residue. A603 and A606 are involved in initial contacts with O2 which are broken upon the arrival and interference of NO●. See Movie 1 for a visualization of the interplay between O2 and NO● at the catalytic site.

