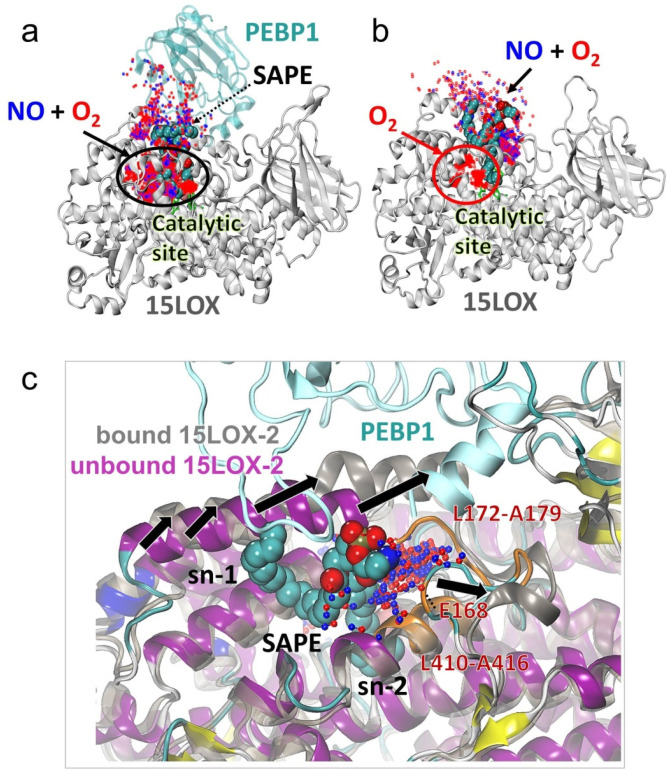
Figure 4.
Conformational change in 15LOX-2 induced upon PEBP1 binding allows NO● binding to the catalytic sites in the presence of SAPE. Panels a and b compare the binding patterns of O2/NO● to 15LOX-2 in the presence (a) and absence (b) of complexation with PEBP1. The positions of NO● (blue dots) and O2 (red dots) sampled during MD snapshots are displayed. These refer to contacts (within 3.5 Å) between O2/NO● and (a) SAPE-bound 15LOX-2/PEBP1 complex and (b) SAPE-bound 15LOX-2 (with O2/NO● molecules within 7 Å from any SAPE atom). Both O2 and NO● molecules sample the catalytic site in the presence of PEBP1 (panel a, black oval). In the absence of PEBP1 the catalytic site exclusively harbors the O2 molecules (red oval). Snapshots from another run (Supplementary Figure S5) illustrate the reproducibility of the results. (c) Structural change induced by PEBP1 binding. Structural alignment of 15LOX-2 structure (after 150 ns simulation) in PEBP1-bound (dark grey) and unbound (magenta) forms with SAPE substrate (spheres) and accumulation of NO● molecules near the loop L172-A179 (orange) on the surface, are shown. Black arrows show the direction of conformational change in the α2 helix and the T166-A179 loop, providing access to both NO● (blue dots) and O2 (red dots). Other NO● molecules attracted by the stearic acid sn-1 chain of SAPE are hidden for better visualization.

