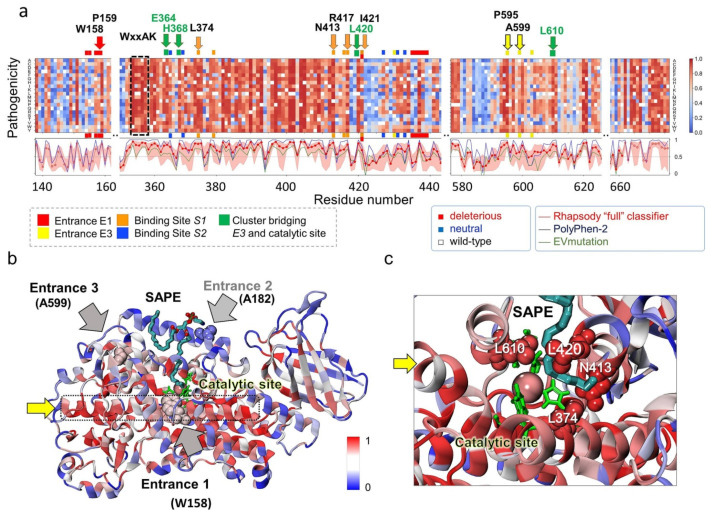
Figure 6.
In silico saturation mutagenesis results for human 15LOX-2. (a) Pathogenicity probabilities for all substitutions, plotted as a function of residue number (abscissa) for all possible amino acid substitutions (ordinate). The probabilities are represented by a heatmap color-coded from blue (neutral) to red (deleterious). Colored horizontal bars (red, yellow, orange, and blue) along the upper abscissa denote the sites linked to specific functions (see labels under the map, Figure 2 and Table S2). Those distinguished by highly deleterious response to substitution are labeled. Black dashed box highlights the conserved WxxAK motif. The curves in the panel under the map indicate the sensitivity of a given residue to any mutation, as predicted by Rhapsody (red curve), EVmutation (green), and PolyPhen-2 (blue). Entrance 2 (on α2 helix) is broadly neutral to substitutions and not included in the heatmap. (b) Ribbon diagram of 15LOX-2/SAPE color-coded by pathogenicity probabilities (if mutated). The regions shown in space-filling representation and labeled (pointed by the black/grey arrows) are the entrances E1–E3. Catalytic residues are displayed in green and SAPE as cyan-red-blue sticks. (c) Close-up view of the catalytic site with bound substrate coordinated by four residues, L374, L420, L610, and N413, whose substitutions would be highly damaging to function. Yellow arrow points to the α12-14 scaffolding helix.

