Figure 7.
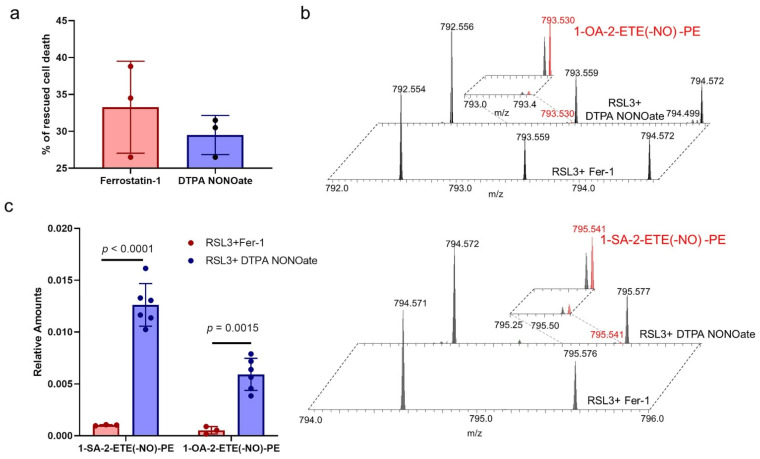
Formation of nitrosylated PE during the inhibition of ferroptosis by NO● (a) Bar graph showing the decrease in cell death upon addition of ferroptosis inhibitor Ferrostatin-1 and DTPA NONOate in RAW 264.7 M2 macrophages treated with RSL3. Data are mean ± SD, n = 3 and no statistical significance was observed. (b) Mass spectrum showing the presence of two nitrosylated PE species, 1-OA-2-ETE(-NO)-PE (top panel) and 1-SA-2-ETE(-NO)-PE (bottom panel) in RAW 264.7 M2 macrophages treated with RSL3+Fer-1 (bottom section) and RSL3+DTPA NONOate (top section). Inset shows the magnified spectrum. (c) Quantities of 1-OA-2-ETE(-NO)-PE and 1-SA-2-ETE(-NO)-PE in RAW 264.7 M2 macrophages treated with RSL3+Fer-1 and RSL3+DTPA NONOate. Data are mean ± SD, n = 3 for RSL3+Fer-1 cells and 6 for RSL3+DTPA NONOate cells. p values are calculated using two-way ANOVA followed by Sidak post-hoc test.

