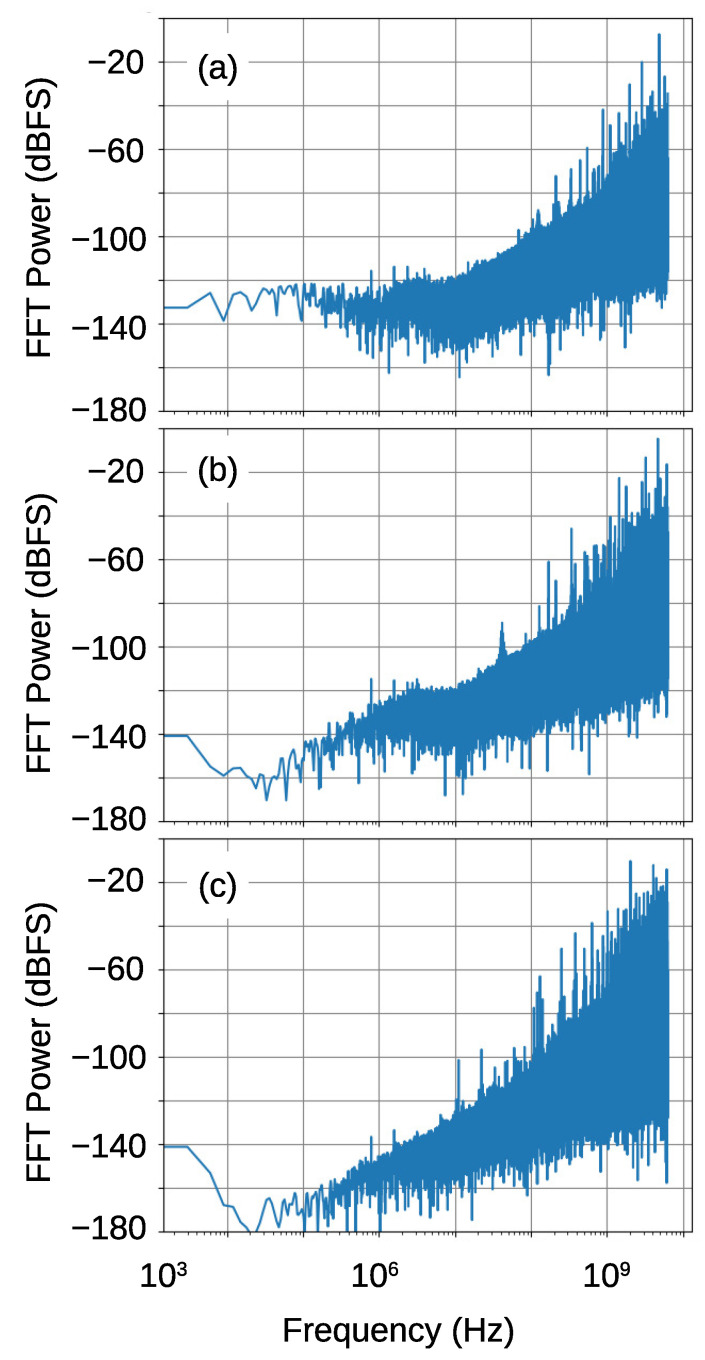
Figure 16.
FFT spectra of the output PDM signals from the FPGA. The top figure (a) shows the result of the reflection oscillator in the previous work. The second figure (b) shows the result of the transmission oscillator, and the bottom figure (c) shows that of the transmission oscillator when the signal was down-converted by the mixer with 9.2 GHz LO. The results are normalized by the full-scale input, .

