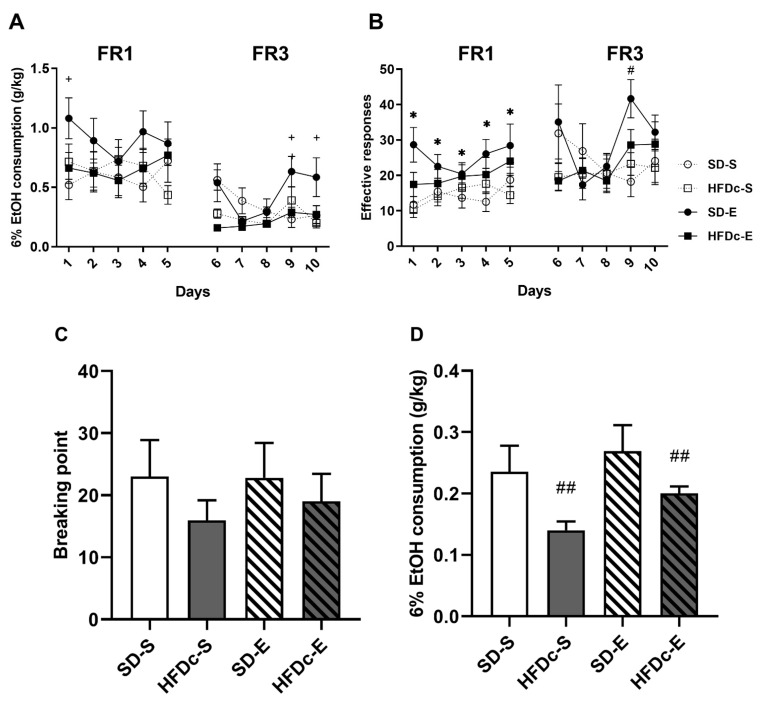
Figure 6.
Effects of continuous access to high-fat diet (HFD) on effective responses and oral ethanol EtOH self-administration in OF1 mice. Data are presented as mean (± SEM): (A) g/kg of 6% EtOH consumption (B) the number of effective responses during FR1 and FR3. The columns represent means and the vertical lines ± SEM of (C) breaking point values during PR and (D) amount of 6% EtOH consumption during the PR session * p < 0.05 significant differences in the groups that received BD (SD-E and HFD-E) compared to the saline groups (SD-S and HFDc-S). + p < 0.05 significant differences between SD-E with respect to SD-S. # p < 0.05 significant differences between the BD-treated groups and the saline-treated groups in Day 9. ## p < 0.01 significant differences between the HFDc groups (HFDc-S and HFDc-E) compared to the SD groups (SD-S and SD-E).

