Figure 2.
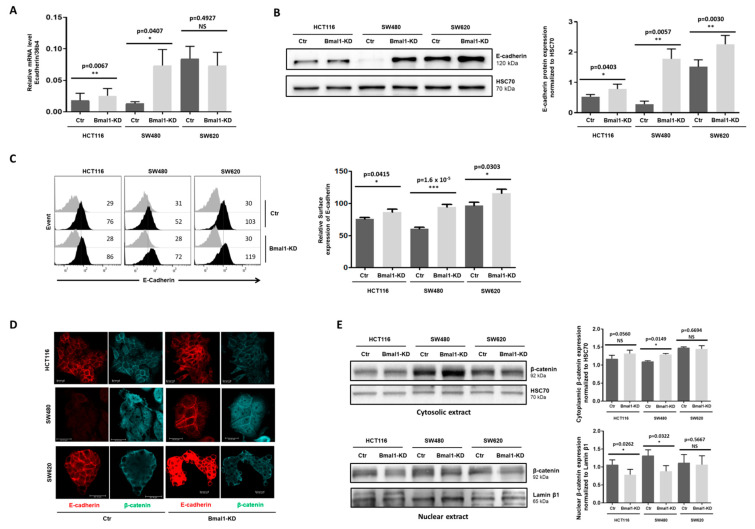
BMAL1-KD increased the plasma membrane colocation of E-cadherin and β-catenin but decreased β-catenin nuclear location. (A) Quantitative RT-PCR assay revealed an increased E-cadherin expression in two primary BMAL1 knockdown (BMAL1-KD) cell lines (n = 4, * p < 0.05, ** p < 0.01) in comparison to control (Ctr) cells. (B) Increased E-cadherin expression in BMAL1-KD CRC cell lines was checked by Western blot. Left, Representative Western blots of 6 independent experiments are shown. Right, Bar charts represents E-cadherin expression normalized to HSC70 (n = 6,* p < 0.05, ** p < 0.01). All data are shown as means ± SEM. (C) Enhanced E-cadherin surface expression on BMAL1-KD CRC cell lines was ascertained by flow cytometry analysis. Left, Representative staining of one experiment are shown. Cell staining with the anti-E-Cadherin antibody is represented by the dark-colored histograms and staining with the isotype-matched control antibody correspond to the gray histograms. At the right of each histogram are shown the mean fluorescence intensity values for each staining. Right, Graphs represent the relative expression of E-cadherin in three independent experiments (* p < 0.05, *** p < 0.001). (D) Confocal laser scanning microscopy showing stainings for E-cadherin (red) and β-catenin (blue). BMAL1-KD promotes elevated levels of E-cadherin and β-catenin at the plasma membrane of both HCT116 and SW480 cells, whereas BMAL1-KD only increased evidently the membrane localization of E-cadherin but not β-catenin in SW620 cells. Scale bars, 20 μm. These data are representative of three independent experiments. (E) Cytoplasmic (upper panels) and nuclear (lower panels) extracts of BMAL1-KD and control (Ctr) cell lines were analyzed by Western blot. Left, Representative stainings of one experiment are shown. Right, Graphs represent the quantification of Western blot signals, corresponding to β-catenin expression normalized to HSC70 (cytoplasmic extracts) or Lamin β1 (nuclear extracts). Data are represented as means ± SEM for 5 independent determinations (* p < 0.05). A significant increase in β-catenin cytoplasmic localization was found in SW480 BMAL1-KD cells. HCT116 BMAL1-KD cells presented an increased tendency of cytoplasmic β-catenin (p = 0.056). A significant decrease in β-catenin nuclear localization (n = 5, * p < 0.05) was found in the SW480 BMAL1-KD and HCT116 BMAL1-KD cell lines.

