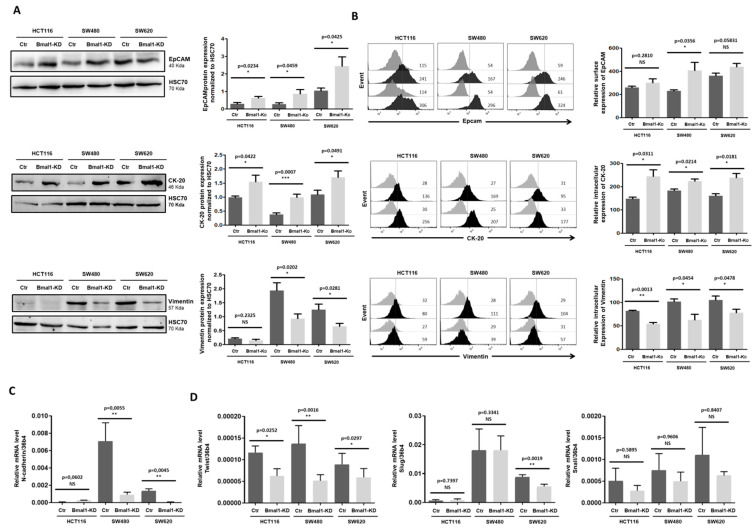
Figure 3.
BMAL1-KD leans epithelial–mesenchymal balance of CRC cells toward epithelial properties. (A) Western blot revealed that BMAL1-KD increased the expression of the epithelial markers EpCAM and cytokeratin-20 (CK-20) and decreased the mesenchymal marker (vimentin) in BMAL1-KD CRC cell lines. HSC70 was used as loading controls. (B) EpCAM surface expression and intracellular expression of vimentin and CK-20 were analyzed by flow cytometry. Left, Representative stainings of one experiment are shown. Staining of the cells with the antigen-specific antibody is represented by the dark-colored histograms and staining with the isotype-matched control antibody correspond to the gray histograms. At the right of each histogram are shown the mean fluorescence intensity values for each staining. Right, Graphs represent the relative expression of EpCAM, CK-20, and vimentin in three independent experiments (* p < 0.05, ** p < 0.01, *** p < 0.001). (C) Quantitative RT-PCR revealed that RNA expression level of mesenchymal hallmarker N-cadherin was significantly decreased in SW480 BMAL1-KD and SW620 BMAL1-KD cell lines. The BMAL1-KD HCT116 cell line exhibited a decreased tendency of N-cadherin (p = 0.0762) (n = 5, ** p < 0.01). Data are shown as means ± SEM. (D) Quantitative RT-PCR analyzed the RNA expression level of three EMT-activating transcription factors Twist, Slug, and Snail in control and BMAL1-KD CRC cell lines. BMAL1-KD decreased significantly the expression of Twist but not Slug and Snail (n = 5, * p < 0.05, ** p < 0.01). Data are shown as means ± SEM.

