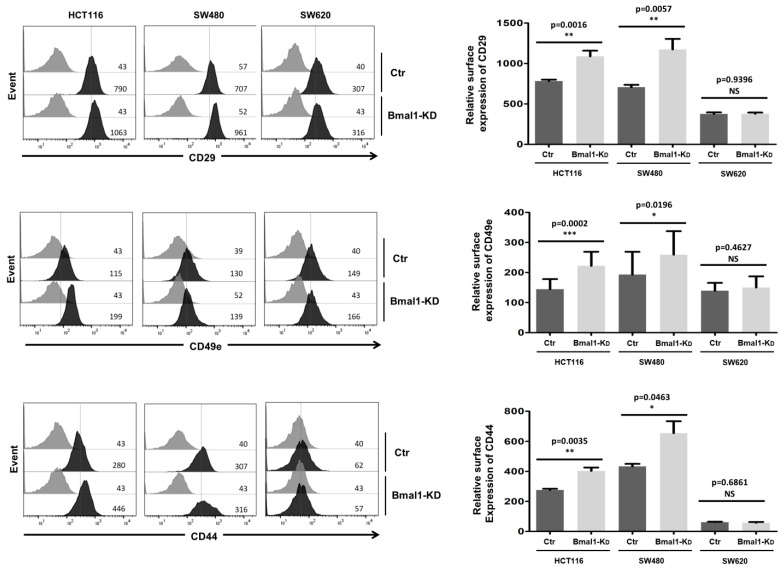
Figure 6.
BMAL1-KD increased the expression of cell adhesion molecules on CRC cell lines. Flow cytometry analysis of surface expression of CD29 (integrin β1), CD49e (integrin α5), and CD44 adhesion molecules. Left, a representative direct staining of four independent experiments is shown. The dark-colored bars correspond to cells incubated with phycoerythrin (PE)-conjugated antibodies against CD29, CD49e, and CD44, and grey bars correspond to cells incubated with the isotype-matched control antibody. Mean fluorescence intensity values for each marker are shown at the right of each histogram. Right, BMAL1-KD led to increased expression of membranous CD29, CD49e, and CD44, mostly in primary BMAL1-KD CRC cell lines (n = 3, * p < 0.05, ** p < 0.01, *** p < 0.001). Data are shown as means ± SEM.

