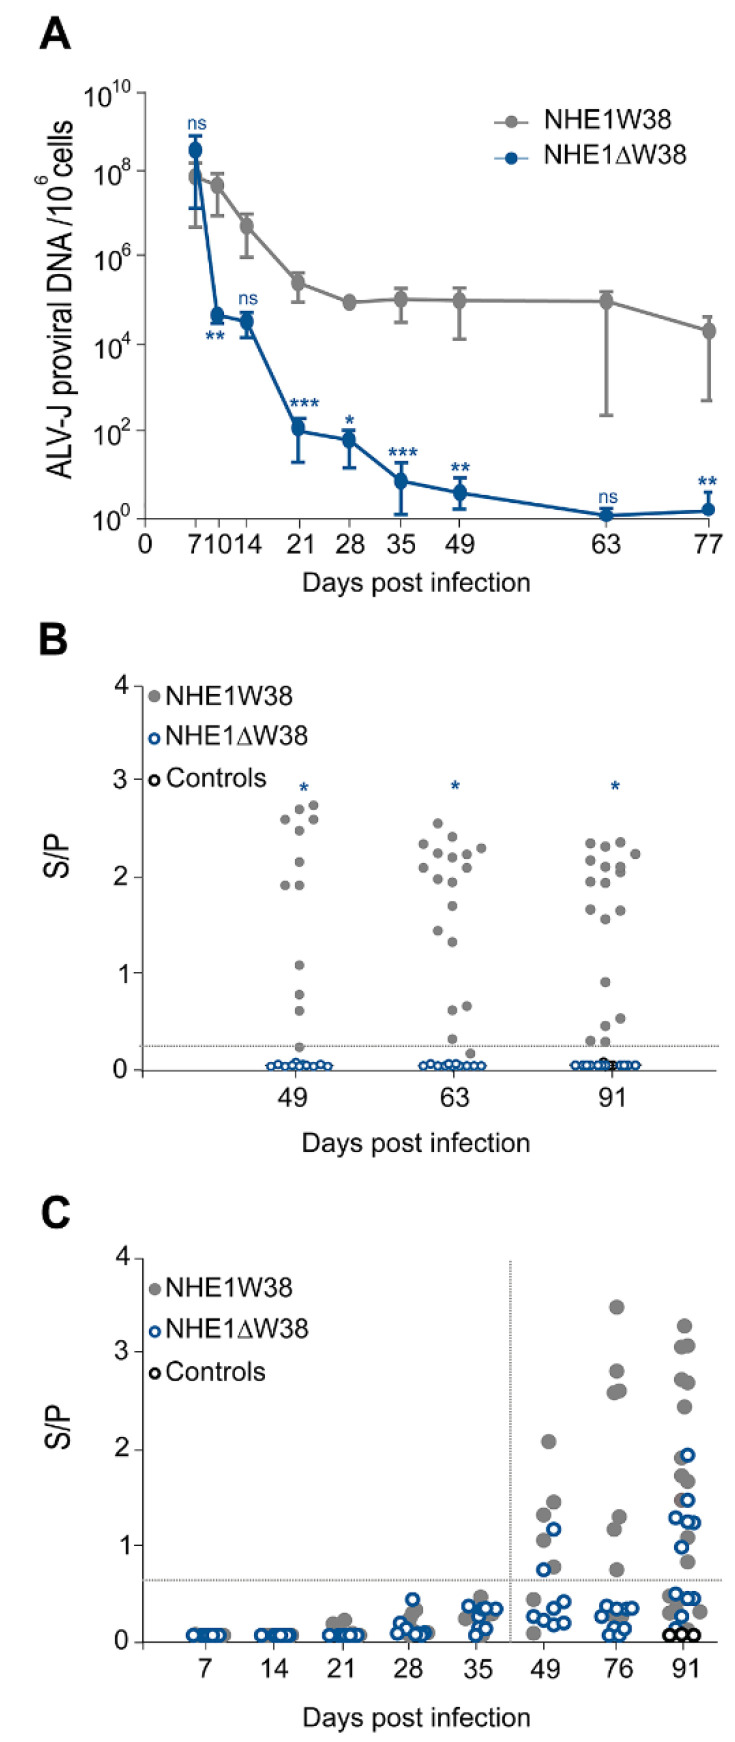
Figure 1.
Serological analysis of ALV-J infection. (A) Quantitative analysis of ALV-J proviral genome copies by qPCR to determine viremia in infected NHE1ΔW38 (n = 8) and NHE1W38 birds (n = 7). Genome copies are displayed relative to 106 cellular copies from 7 to 77 dpi. Error bars indicate standard deviation (SD). Significant differences are indicated by asterisk(s) (* p < 0.05, ** p < 0.01, *** p < 0.001; multiple Mann–Whitney U test). (B) Detection of ALV p27-specific antigen in cloacal swabs from 49, 63, and 91 dpi by ELISA (n ≥ 11). S/P represents sample (S) to positive control (P) ratio that indicates the relative level of antigen. S/P > 0.20 were considered as positive. Significant differences are indicated by asterisk (p < 0.05; Mann–Whitney U test). Non-infected birds served as control. (C) Detection of ALV-J gp85-specific plasma (7–35 dpi) and serum (49–91 dpi) antibodies by ELISA (n ≥ 7). S/P represents the relative antibody titer. S/P > 0.60 were considered as positive. Statistical analysis of 7–49 dpi was performed using the Mann–Whitney U test (p > 0.05) and a two-sided Student’s t-test was used for statistical analysis of 76 and 91 dpi (p > 0.05). Non-infected birds served as control.

