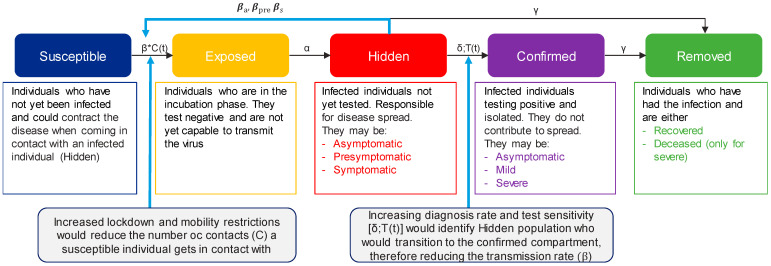
Figure 1.
Diagram of the modified SEIR model. β represents the transmission rate and is adjusted based on whether the infectious individual is asymptomatic (βa = 0.002), pre-symptomatic (βs = 0.186) or symptomatic (βpre = 0.01); C(t) is the number of contacts at that moment t; α is the incubation time (α = 0.18); δ is the diagnosis rate and depends on the number of tests executed at that moment t [T(t)], the sensitivity of the test and the spread of the infection; γ is the recovery rate, which is adjusted based on whether the patient is mild (γ = 0.07) or severe (γR = 0.02) and the death rate for severe patients (γD = 0.009).

