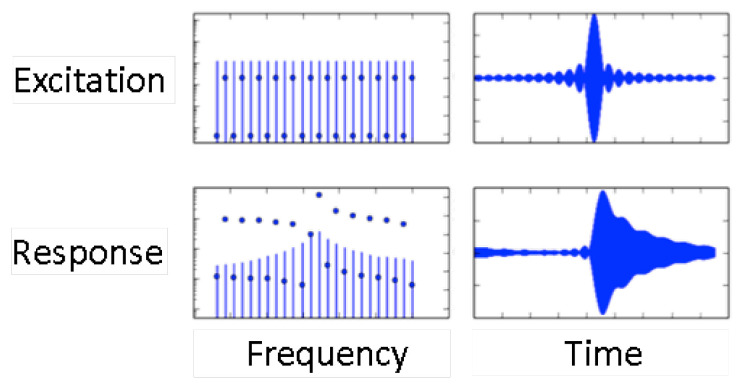
Figure 6.
Excitation and response of a resonator in the frequency domain and the time domain as determined with the MLA. The instrument applies a comb of up to 32 frequencies. The current response shows the resonance curve (bottom left). Transformed to the time domain (right), the excitation amounts to a sequence of pulses with a spacing in time of 1/(Δfcomb). The response is similar to a ring-down process (lower right). Downloaded from www.intermodulation-products.com/applications/lock-in, accessed on 13 February 2019.

