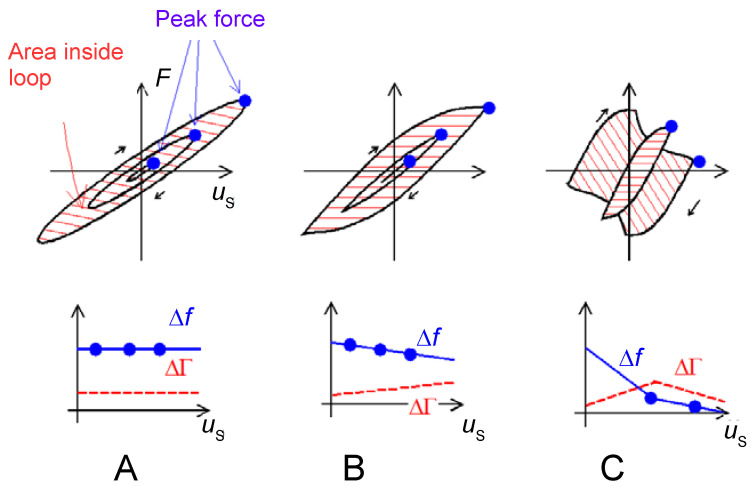
Figure 28.
The top panels show friction loops for three different contacts. ΔΓ is strictly proportional to the area inside the loop, divided by . Δf is nearly proportional to the maximum force divided by the maximum displacement (blue dots). The left-hand side (A) shows the linear viscoelastic contact. Δf and ΔΓ are constant. For partial slip (B) the ellipse-shaped loop turns into a lens-shaped loop. The area inside the loop increases with amplitude as and increases with amplitude, in consequence. The sketch in (B) is based on a quantitative model. The right-hand side (C) sketches the transition to gross slip. The diagram is motivated by experimental results [141], not by a quantitative model. decreases at large amplitude because the friction force in steady sliding weakly depends on velocity. Dividing by causes to decrease with .

