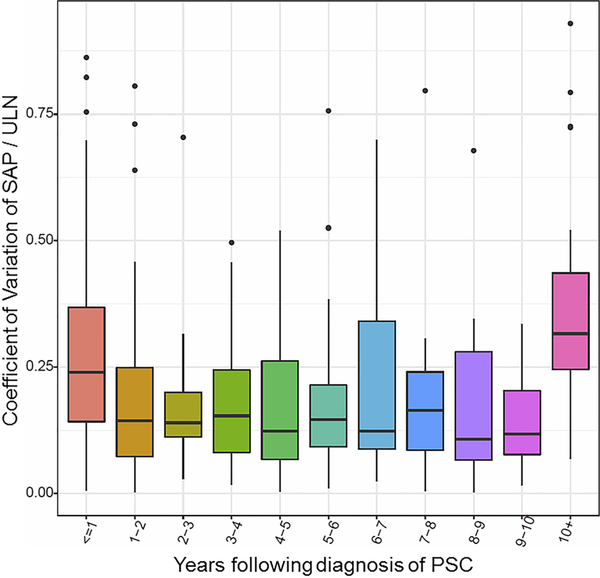
Fig. 5.
Intra-individual alkaline phosphatase variability (Examines every SAP value available throughout disease course and all changes that occurred). Each box extends vertically from the first to the third quartiles of coefficient of variation. The second quartile (median) is plotted by a horizontal line in the boxes. Vertical lines extending from boxes, outside the upper and lower quartiles, indicate variability (minimum and maximum) excluding outliers. Outliers are plotted as individual points

