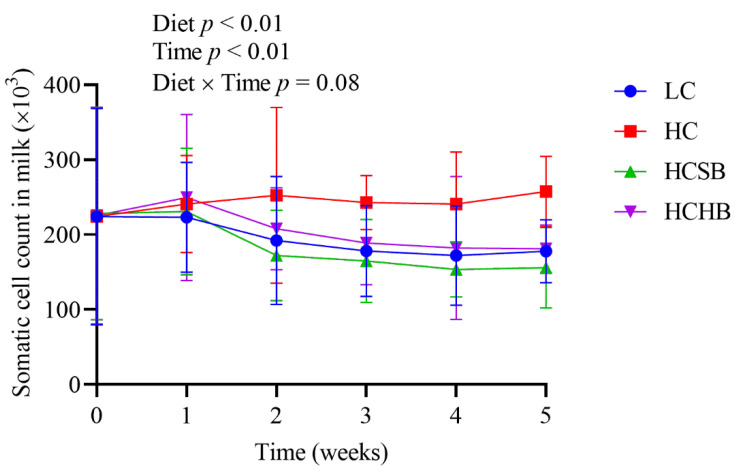
Figure 3.
The somatic cell count in milk. LC: low concentrate diet; HC: high concentrate diet; HCSB: HC supplemented with 1% sodium butyrate; HCHB: HC supplemented with 1% sodium β-hydroxybutyrate. The data are analyzed using the general linear model with repeated measures and presented as means ± standard deviation. A statistically significant difference is presented as a probability value less than 0.05 (p < 0.05, n = 10).

