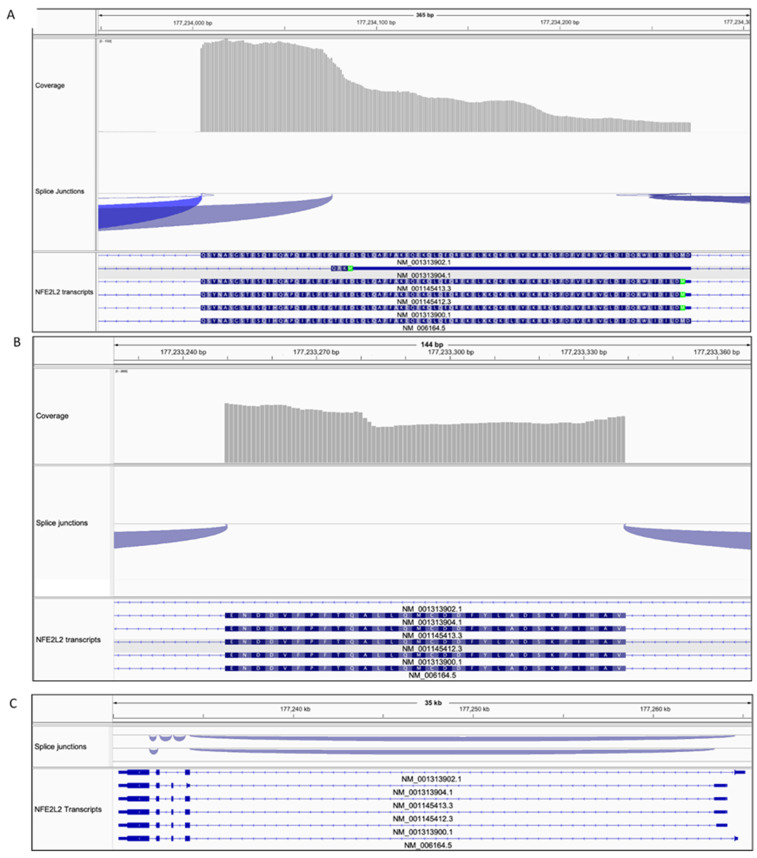
Figure 8.
Expression of different NFE2L2 transcripts in A549 cells based on RNA sequencing data. (A) Visualization of sequence reads alignments within exon 2. Beginning of the exon 2 is on the right-hand and the end on the left-hand side. Splice junctions are represented by arches. Apart from classical junctions at the beginning and the end of the exon, in a portion of reads the 3’ end of exon 2 was spliced out. These reads have been aligned to the transcript NM_001313904.1 (transcripts references are below each transcript). Transcripts sequence within the exon was translated to the encoded amino acids (B) Visualization of sequence reads alignments within exon 3. In the transcript NM_001313902.1 exon 3 is spliced out. (C) Visualization of all the transcripts (6) identified in A549 cells. Exon 1 is on the right-hand and exon 5 on the left-hand side. Assembly of RNA-Seq alignments into potential transcripts together with calculation of expression levels for those transcripts were performed with StringTie software [20]. Visualization of the alignments identified transcripts and junctions was performed in IGV software [21].

