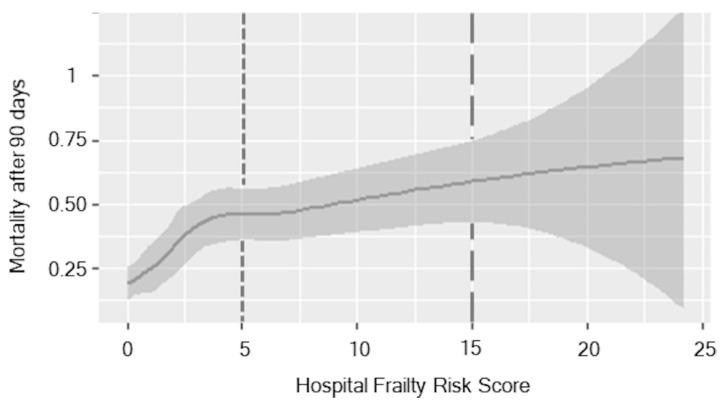
Figure 1.
Association of HFRS over mortality after 90 days. The different HFRS risk categories are divided by the grey lines. The first line is the boundary between the low- and moderate-frailty risk category, the second line between moderate- and high-frailty risk. The grey shade is indicating the standard deviation.

