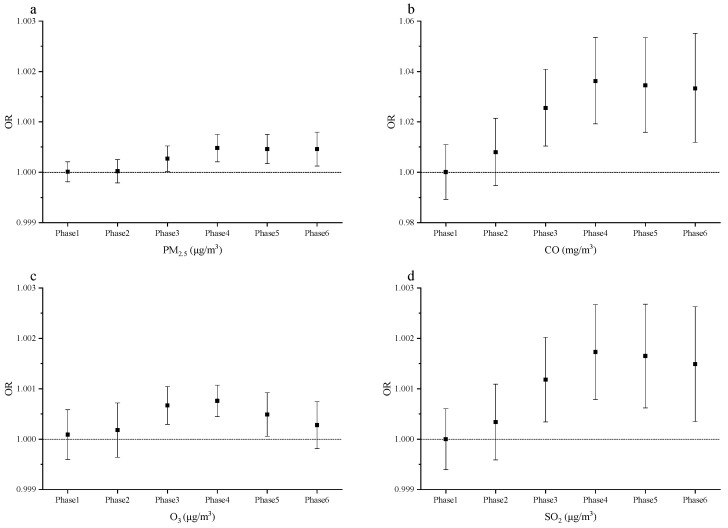
Figure 2.
The relationship between the concentrations of four air pollutants and the gynecological cancer in six exposure phases. (a) The OR and 95% CI of gynecological cancer with a 1.0 μg/m3 increase in PM2.5 concentration; (b) the OR and 95% CI of gynecological cancer with a 1.0-mg/m3 increase in CO concentration; (c) the OR and 95% CI of gynecological cancer with a 1.0-μg/m3 increase in O3 concentration; (d) the OR and 95% CI of gynecological cancer with a 1.0-μg/m3 increase in SO2 concentration.

