. 2020 Mar 10;11(12):3332–3344. doi: 10.1039/d0sc00906g

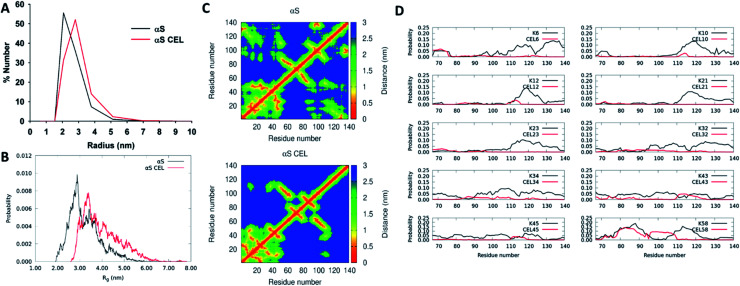
Fig. 3. Effect of CEL on the radius of αS and on its intramolecular contacts. (A) Number-weighted dynamic light scattering (DLS) size distributions obtained for monomeric αS (black) and monomeric αS-CEL (red). (B) Overlapping of the Rg histograms obtained for αS (black) and αS-CEL (red). These histograms were calculated from the ensembles computed by using CG-MD simulations and a factor f of 1.3.28 (C) Contact maps corresponding to the central structure of the most populated cluster in αS (top) and in αS-CEL (bottom) obtained from CG-MD simulations (f = 1.3). (D) Propensity of each Lys (in αS; black) or of each CEL moiety (in αS-CEL; red) in the N-terminal domain (M1-K60) to stablish transient contacts with residues at the NAC or at the C-terminal domains. A contact is defined as a distance ≤1.5 nm. The residue–residue propensity contacts were determined from the CG-MD structures obtained during 1400 ns simulations (f = 1.3).

Fig. 3