. 2020 Mar 10;11(12):3332–3344. doi: 10.1039/d0sc00906g

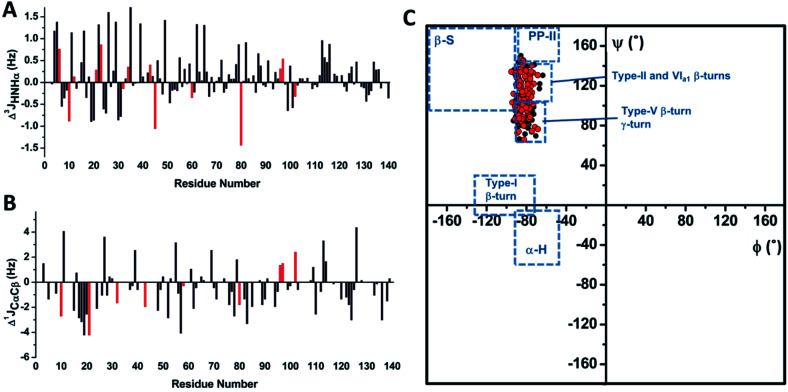
Fig. 4. Determining the J coupling constants and the dihedral angles for αS and αS-CEL. (A) Sequence-dependent variations in the 3JHN-Hα coupling constants of αS as a result of CEL formation (Δ3JHN-Hα = 3JHN-Hα_αS-CEL3JHN-Hα_αS). Data corresponding to the Lys residues are colored in red. (B) Sequence-dependent variations in the 1JCαCβ coupling constants of αS as a result of CEL formation (Δ1JCαCβ = 1JCαCβ-αS-CEL1JCαCβ-αS). Gly 1JCαCβ is non-existent, whereas the Δ1JCαCβ values of Asn, Asp, Ser and Thr are not plotted since these residues exhibit slightly high 1JCαCβ values (Fig. S20A) that could involve the misinterpretation of the structural data derived from 1JCαCβ. Data corresponding to the Lys residues are colored in red. (C) Ramachandran plot obtained for monomeric αS (black) and monomeric αS-CEL (red). The ϕ and ψ dihedral angles were obtained from the 3JHN-Hα and 1JCαCβ coupling constants using the corresponding Karplus equations. The different conformational regions in the Ramachandran plot are classified as follows: α-helix, −90°<ϕ<−45° and −60°<ψ<−15°; β-sheet, −180°<ϕ<−90° and 90°<ψ<180°; PPII, −90°<ϕ<−45° and 105°<ψ<180°; type I β-turn, −135°<ϕ<−75° and −15°<ψ<30°;31c type II β-turn, −50<ϕ<−80° and 120°<ψ<150°; type V β-turn, −75<ϕ<−85° and 75°<ψ<85°; type VIa1 β-turn, −60<ϕ<−70° and 130°<ψ<140°; and γ-turn, −80<ϕ<−90° and 60°<ψ<75°.44.

Fig. 4