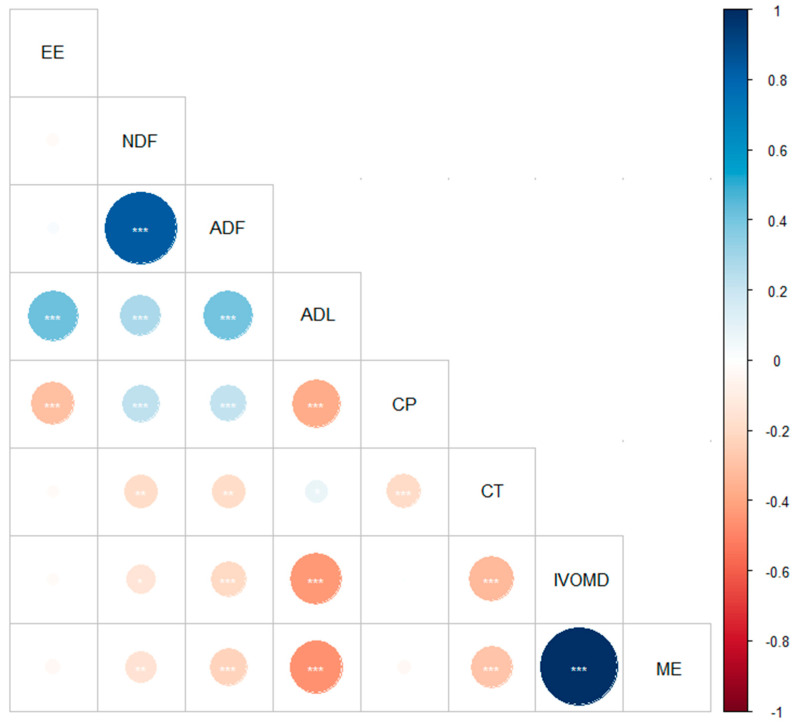
Figure 1.
Correlation plot between the chemical composition, IVOMD, and ME from forage species browsed by goats. Positive and negative correlation coefficients are displayed in blue and brown scale, respectively. EE, ether extract; NDF, neutral detergent fiber; ADF, acid detergent fiber; ADL, lignin; CP, crude protein; CT, condensed tannins; IVOMD, in vitro organic matter digestibility; ME, metabolizable energy. Significance level (*** < 0.001, ** < 0.01, and * < 0.05).

