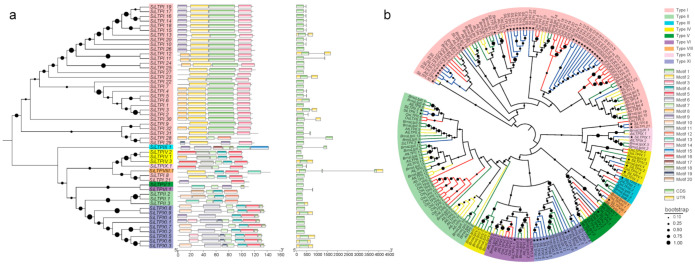
Figure 2.
Phylogenetic relationships, gene structure and motif compositions of SiLTPs. (a) Left: phylogenetic tree of 52 SiLTPs. Different color of arcs represents different types of SiLTPs. Black dot represents the clades support values in the phylogenetic trees. Middle: conserved motif composition of SiLTPs. Different colors of boxes represent different motifs. Gray lines represent the nonconserved sequences. Scale bar at the bottom represents 20aa. Right: intron–exon structure of SiLTPs. Green boxes represent exon, gray lines represent introns, and yellow boxes represent UTR. Scale bar at the bottom represents 500 bp. (b) Phylogenetic tree of A. thaliana, B. rapa, O. sativa and 52 SiLTPs amino acid sequences. Different color of arcs represents different types of nsLTPs. Different color of clades represents different varieties. Stars represent the genes of the sesame variety Zhongzhi13. Black dot represents the clades support values in the phylogenetic trees.

