. 2021 May 18;11(5):895. doi: 10.3390/diagnostics11050895
© 2021 by the authors.
Licensee MDPI, Basel, Switzerland. This article is an open access article distributed under the terms and conditions of the Creative Commons Attribution (CC BY) license (https://creativecommons.org/licenses/by/4.0/).
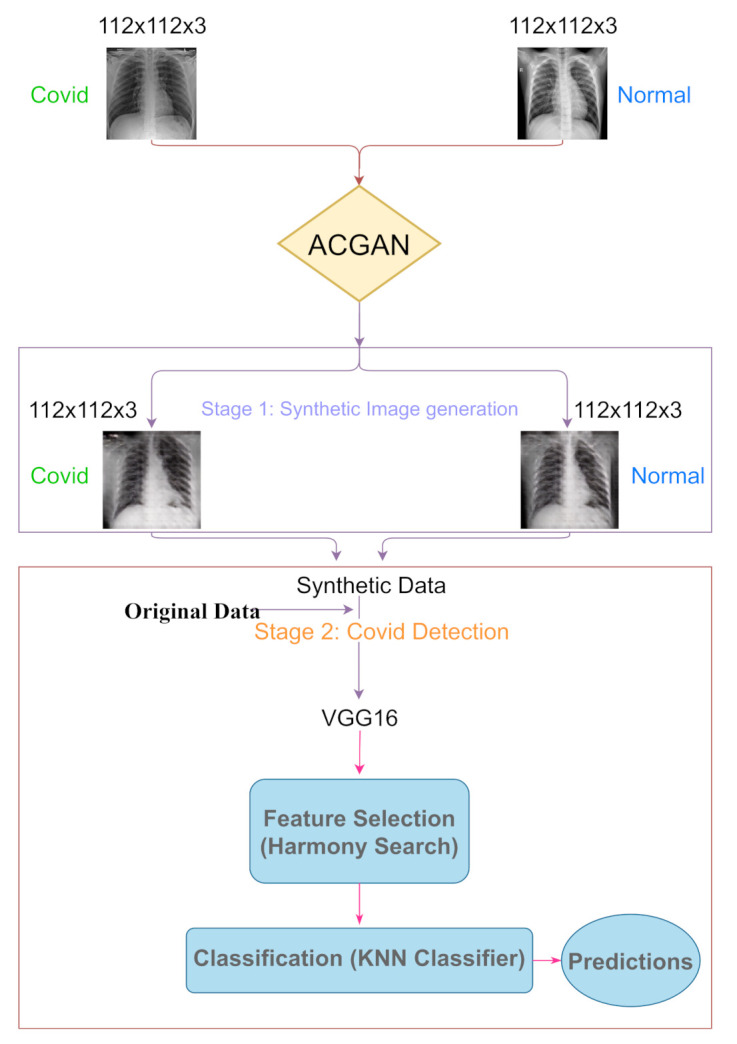
Figure 1.

Flowchart representing the overall process.
