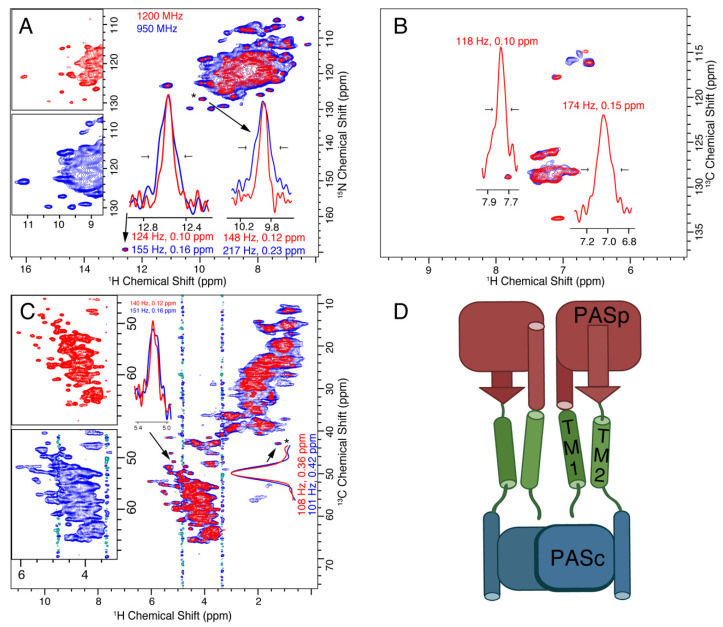
Figure 2.
Resolution and sensitivity of CitApc (H)NH and (H)CH spectra are improved using the 1200 MHz instrument (red) as compared with the 950 MHz (blue). The resulting improvement in peak separation is evident in both the (H)NH (A) and (H)CH (B,C) spectra. The expansion of the alpha region is shown side-by-side. This is especially obvious in the glycine region of the (H)NH spectra below 110 ppm. 1D proton traces (inset in (A–C)) reveal the resolution improvement of various isolated peaks. The aromatic carbon region of the (H)CH spectrum (B) has a sensitivity at the 950 MHz magnet, that was too low for reliable linewidth measurement. The insets show the linewidths of selected peaks that are resolved in the 2D spectrum. The peak indicated with a (*) was used to set the base contour level to a consistent fraction of the peak intensity for each set of overlaid spectra. The topology of the protein is shown in (D) with the sensor PASp domain in red, the transmembrane helices (TM1 and TM2) shown in green, and the PASc domain shown in blue. The t1 noise at about 3.3 and 4.7 ppm are from choline and water protons, respectively.

